

From script to stage · Part 16: Chronicle Workbench, screen by screen

Cratis: from script to stage, and the long run · Part 16 of 26
Chronicle Workbench has nothing to install. The Chronicle server serves it on port 35000, the same TLS port your clients connect to, so starting Chronicle starts the Workbench with it.
Chronicle Workbench ships with Chronicle and runs locally in your browser. Once you’re authorized, it shows what the running Chronicle is doing, and previews how a projection will behave for the projection features it supports.
Say an author registers without an error and never appears in the list of authors. The command succeeded, so the event should be in the log, and the interesting part is what happened after the append. Most of the Workbench’s screens answer a piece of that.
Starting one locally
Section titled “Starting one locally”The quickest Workbench is the development image on your own machine, published on localhost only:
docker run --pull=always --rm -d --name chronicle \ -p 127.0.0.1:35000:35000 \ cratis/chronicle:latest-developmentcurl --insecure --fail --retry 30 --retry-all-errors --retry-delay 1 \ https://localhost:35000/healthWhen the health check prints Healthy, open https://localhost:35000. The development image generates a self-signed certificate in memory, so the browser warns about it the first time. Log in as Admin with the password ChangeMeNow!. That account is built into the development images for local use, and a development image with those credentials shouldn’t be reachable from a staging or production network.
A production image behaves differently at exactly this point. It needs a real TLS certificate, or the server throws at startup. It also creates the administrator without a password, and the first person to open the Workbench sets one. Supply the initial password from your secret store through Authentication:AdminUser, or keep port 35000 unreachable until setup is done. The production guide covers the certificates and the rest of what that image needs.
Authentication is on by default, with Chronicle’s built-in OAuth authority unless you configure an external one. Setting authentication.enabled to false removes it altogether. There’s no login and no token endpoint, and every gRPC service and HTTP endpoint answers anonymously. That suits an instance embedded in one container or process, talking to its own client over loopback and thrown away with it, and nothing reachable as a server.
Store first, then namespace
Section titled “Store first, then namespace”Most screens belong to one event store and one namespace, and the address carries both. A few belong to the store as a whole, among them event types, projections and the list of namespaces. User and application management sits above any single store.
With Arc’s Chronicle integration, each tenant maps to its own namespace. The author who’s missing for tenant Acme is visible only in Acme’s namespace, so pick the store and the namespace before you read anything else. An empty page in the wrong namespace looks exactly like an empty page in the right one.
Is the event there?
Section titled “Is the event there?”The Sequences page is a query editor over an event sequence, with filters, saved queries and a detail view for each event. For the author feature, filter on AuthorRegistered and look for the author’s ID.
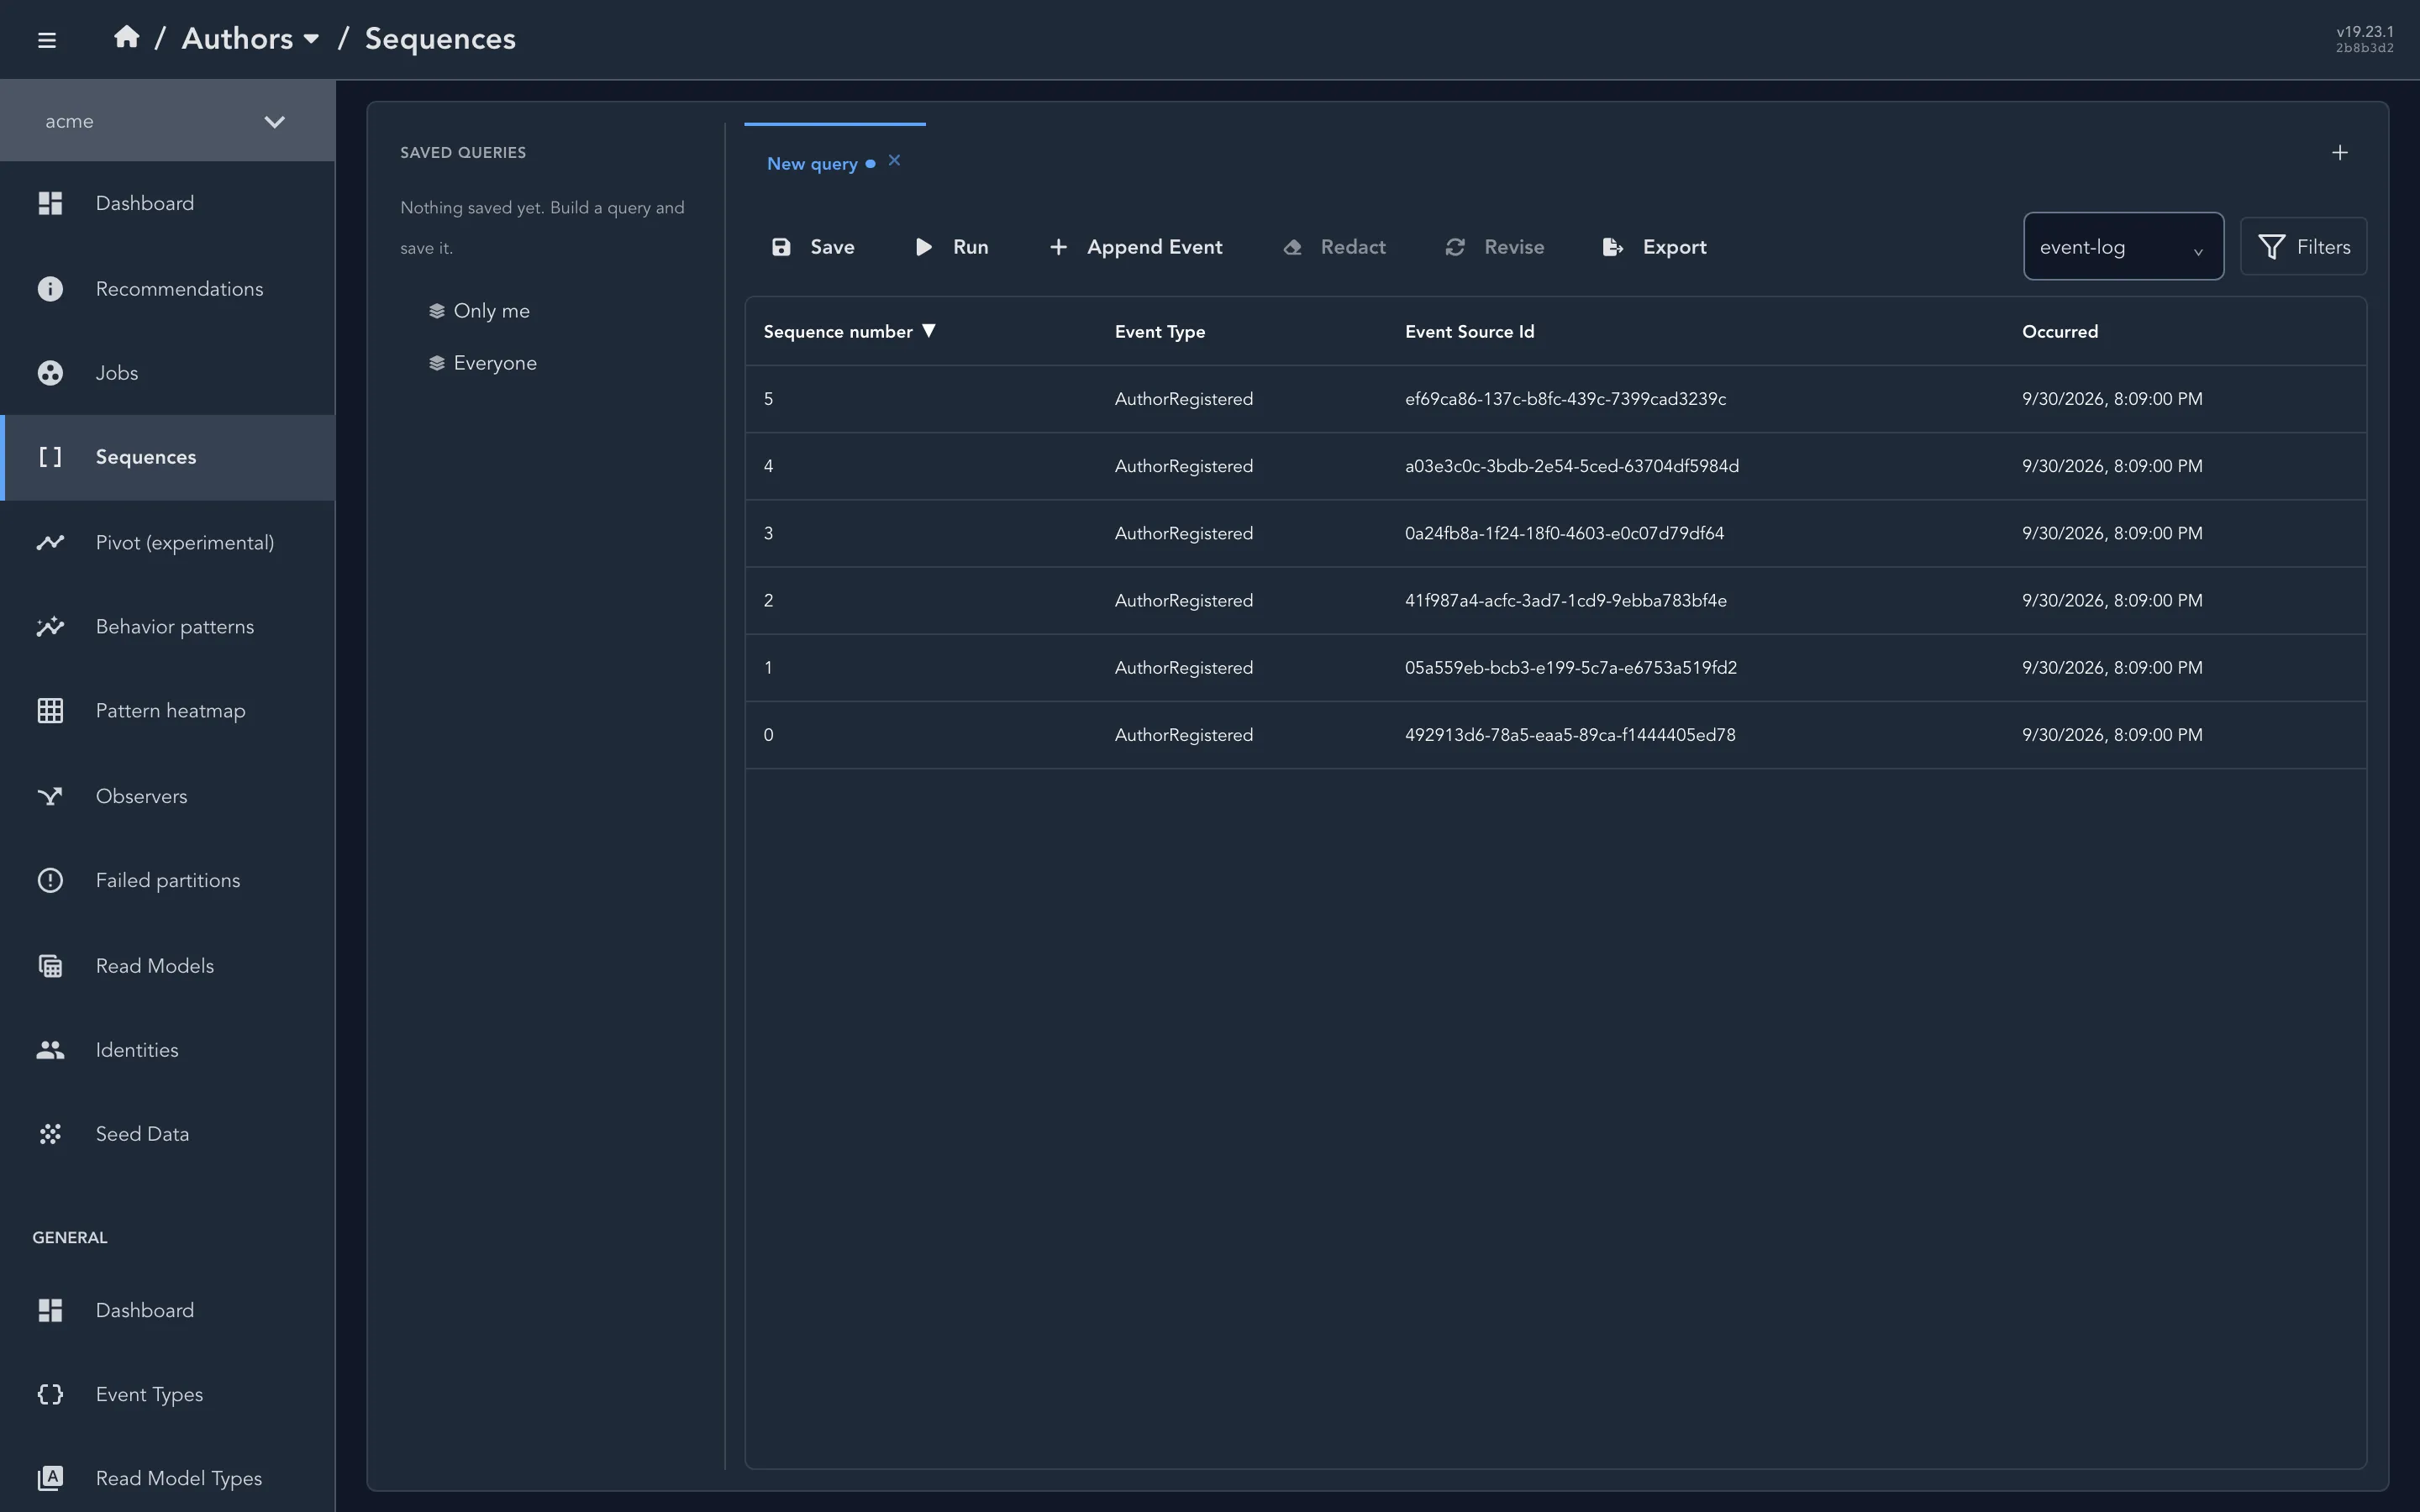
The event log of one namespace.
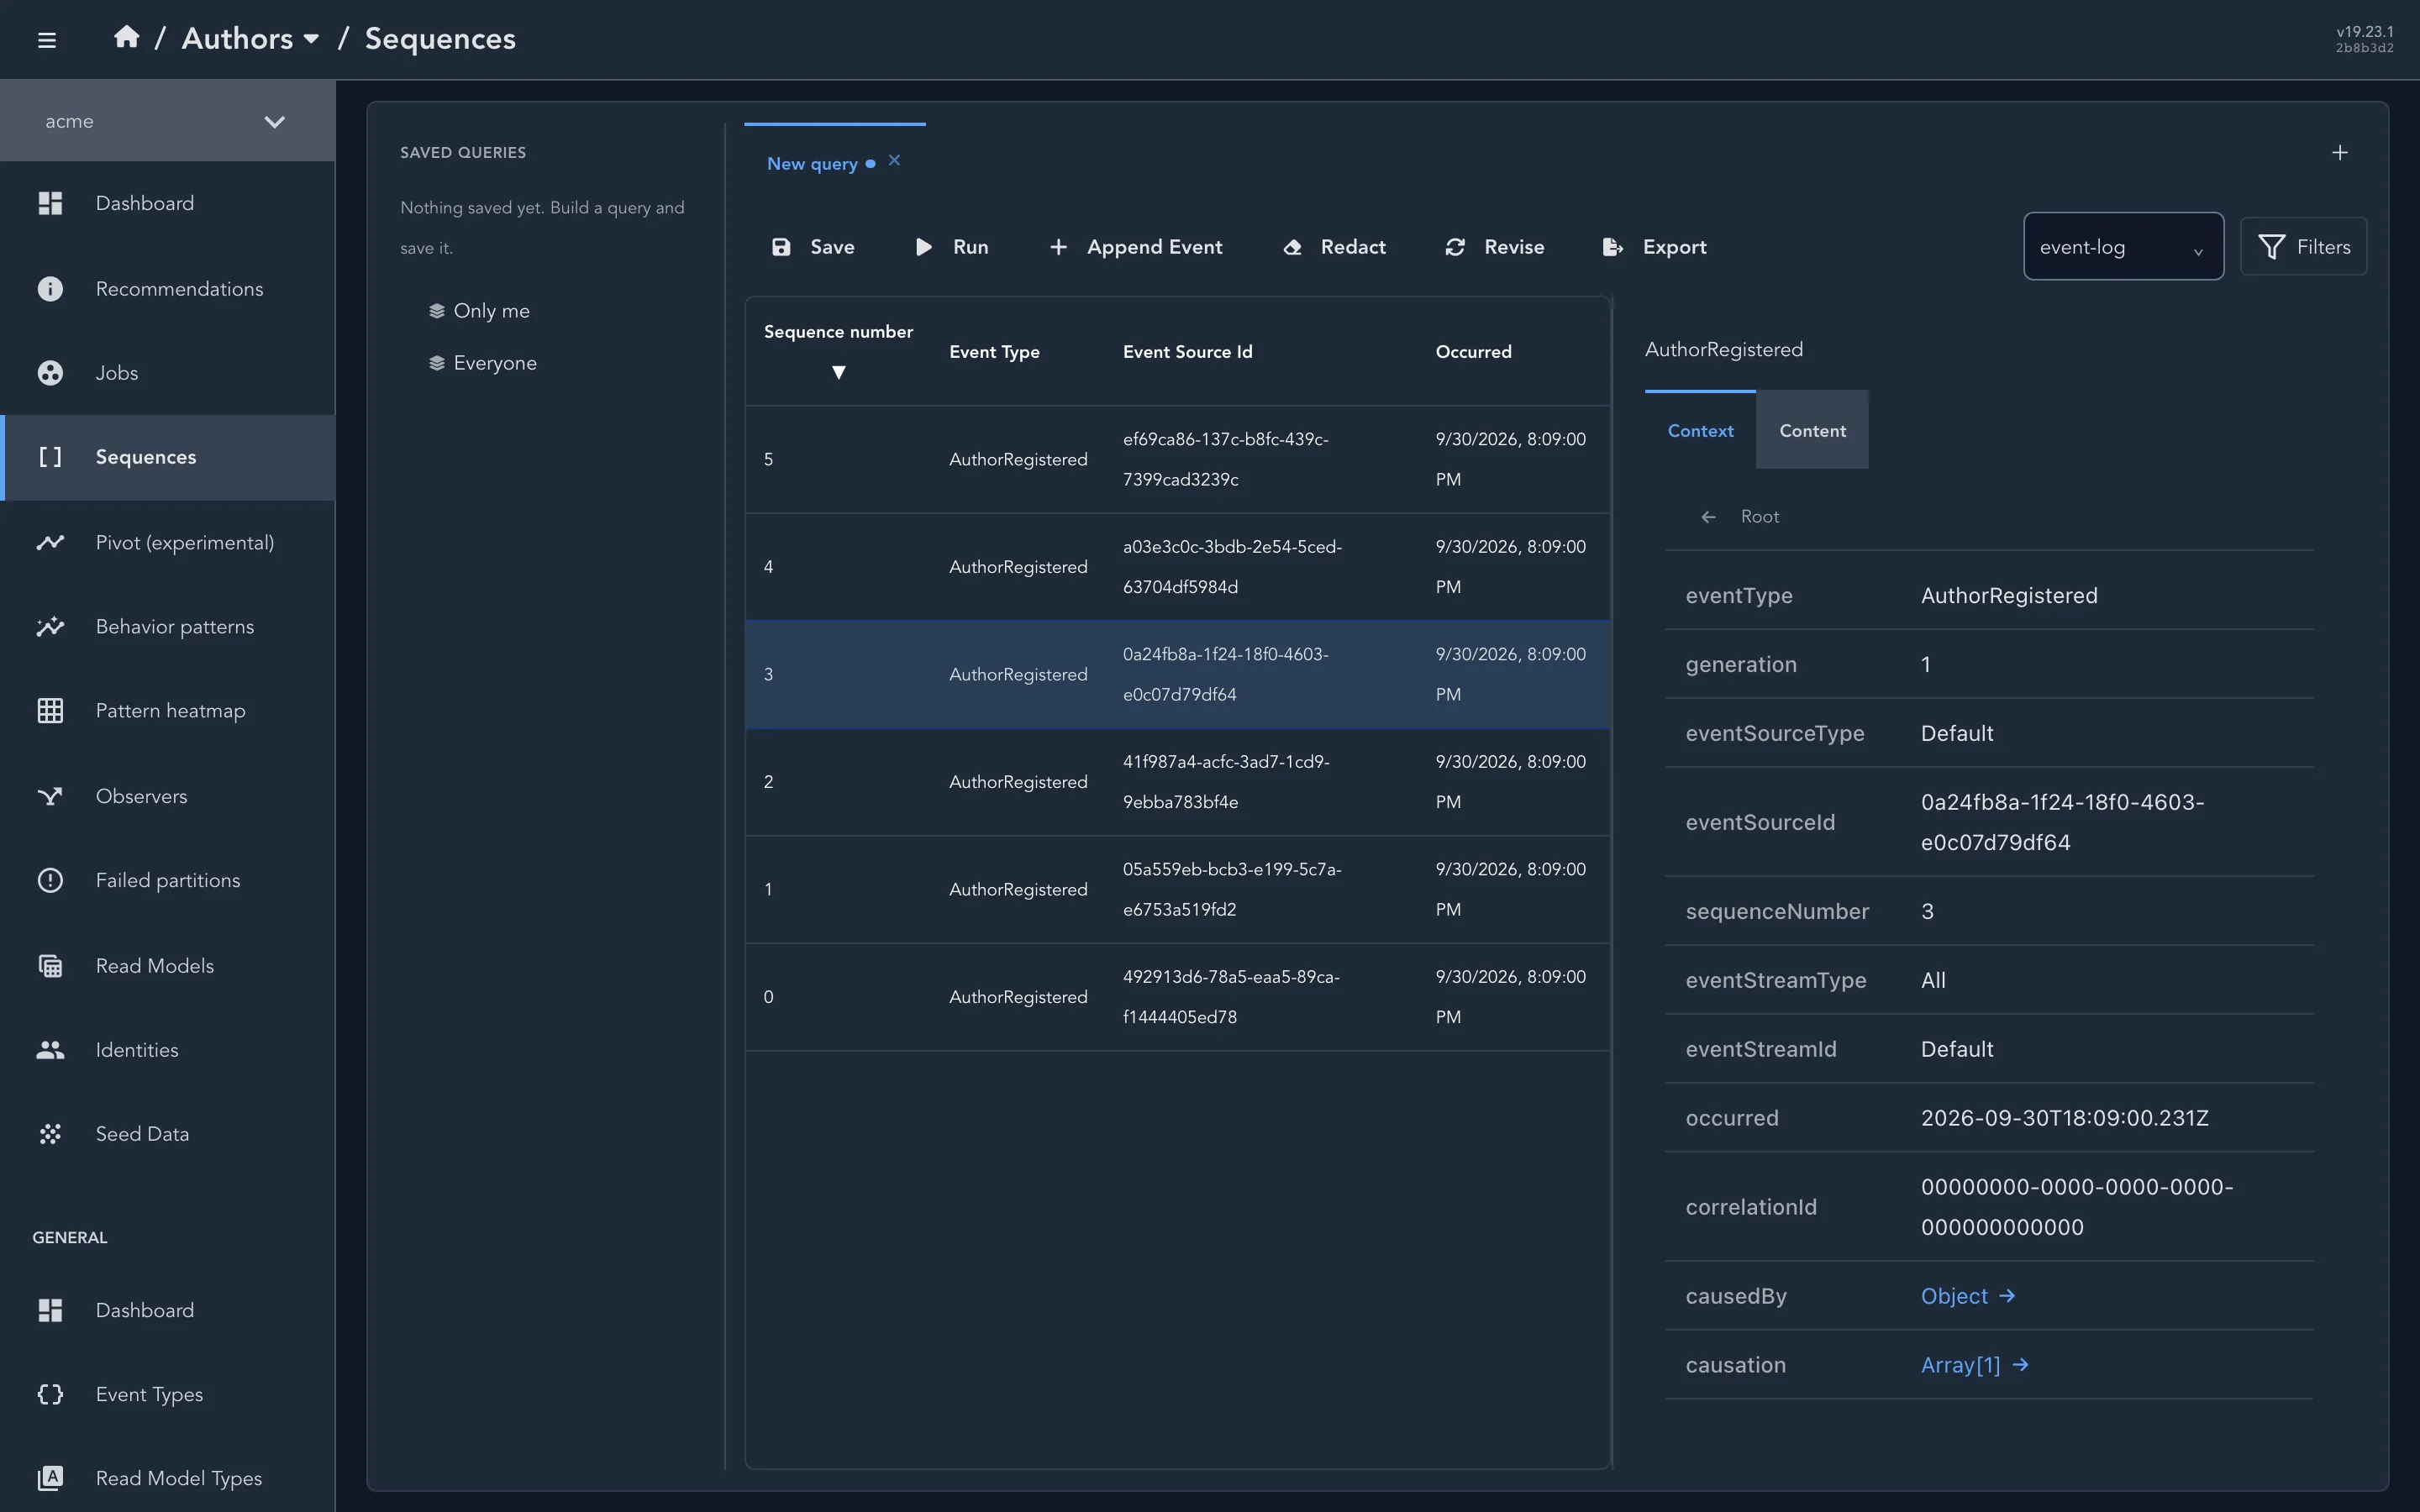
One event’s context, with a Content tab beside it.
If the event isn’t in the log, the problem sits on the write side, and the command result or the append result carries the reason. If it is there, the next question is who should have handled it.
Event types is one store-level list. Selecting a type opens a side panel with its schema and an Observers tab that lists the observers reading it, in every namespace. For AuthorRegistered, that list should include the projection behind the Author read model. An event type that no observer reads is recorded and then ignored, which is sometimes the intent and sometimes the bug.
Who should have handled it
Section titled “Who should have handled it”The Observers page lists every observer in the namespace, projections, reducers and reactors alike. Each row has the observer’s ID, type, owner and state, the next sequence number it will look at and how many events it has handled.
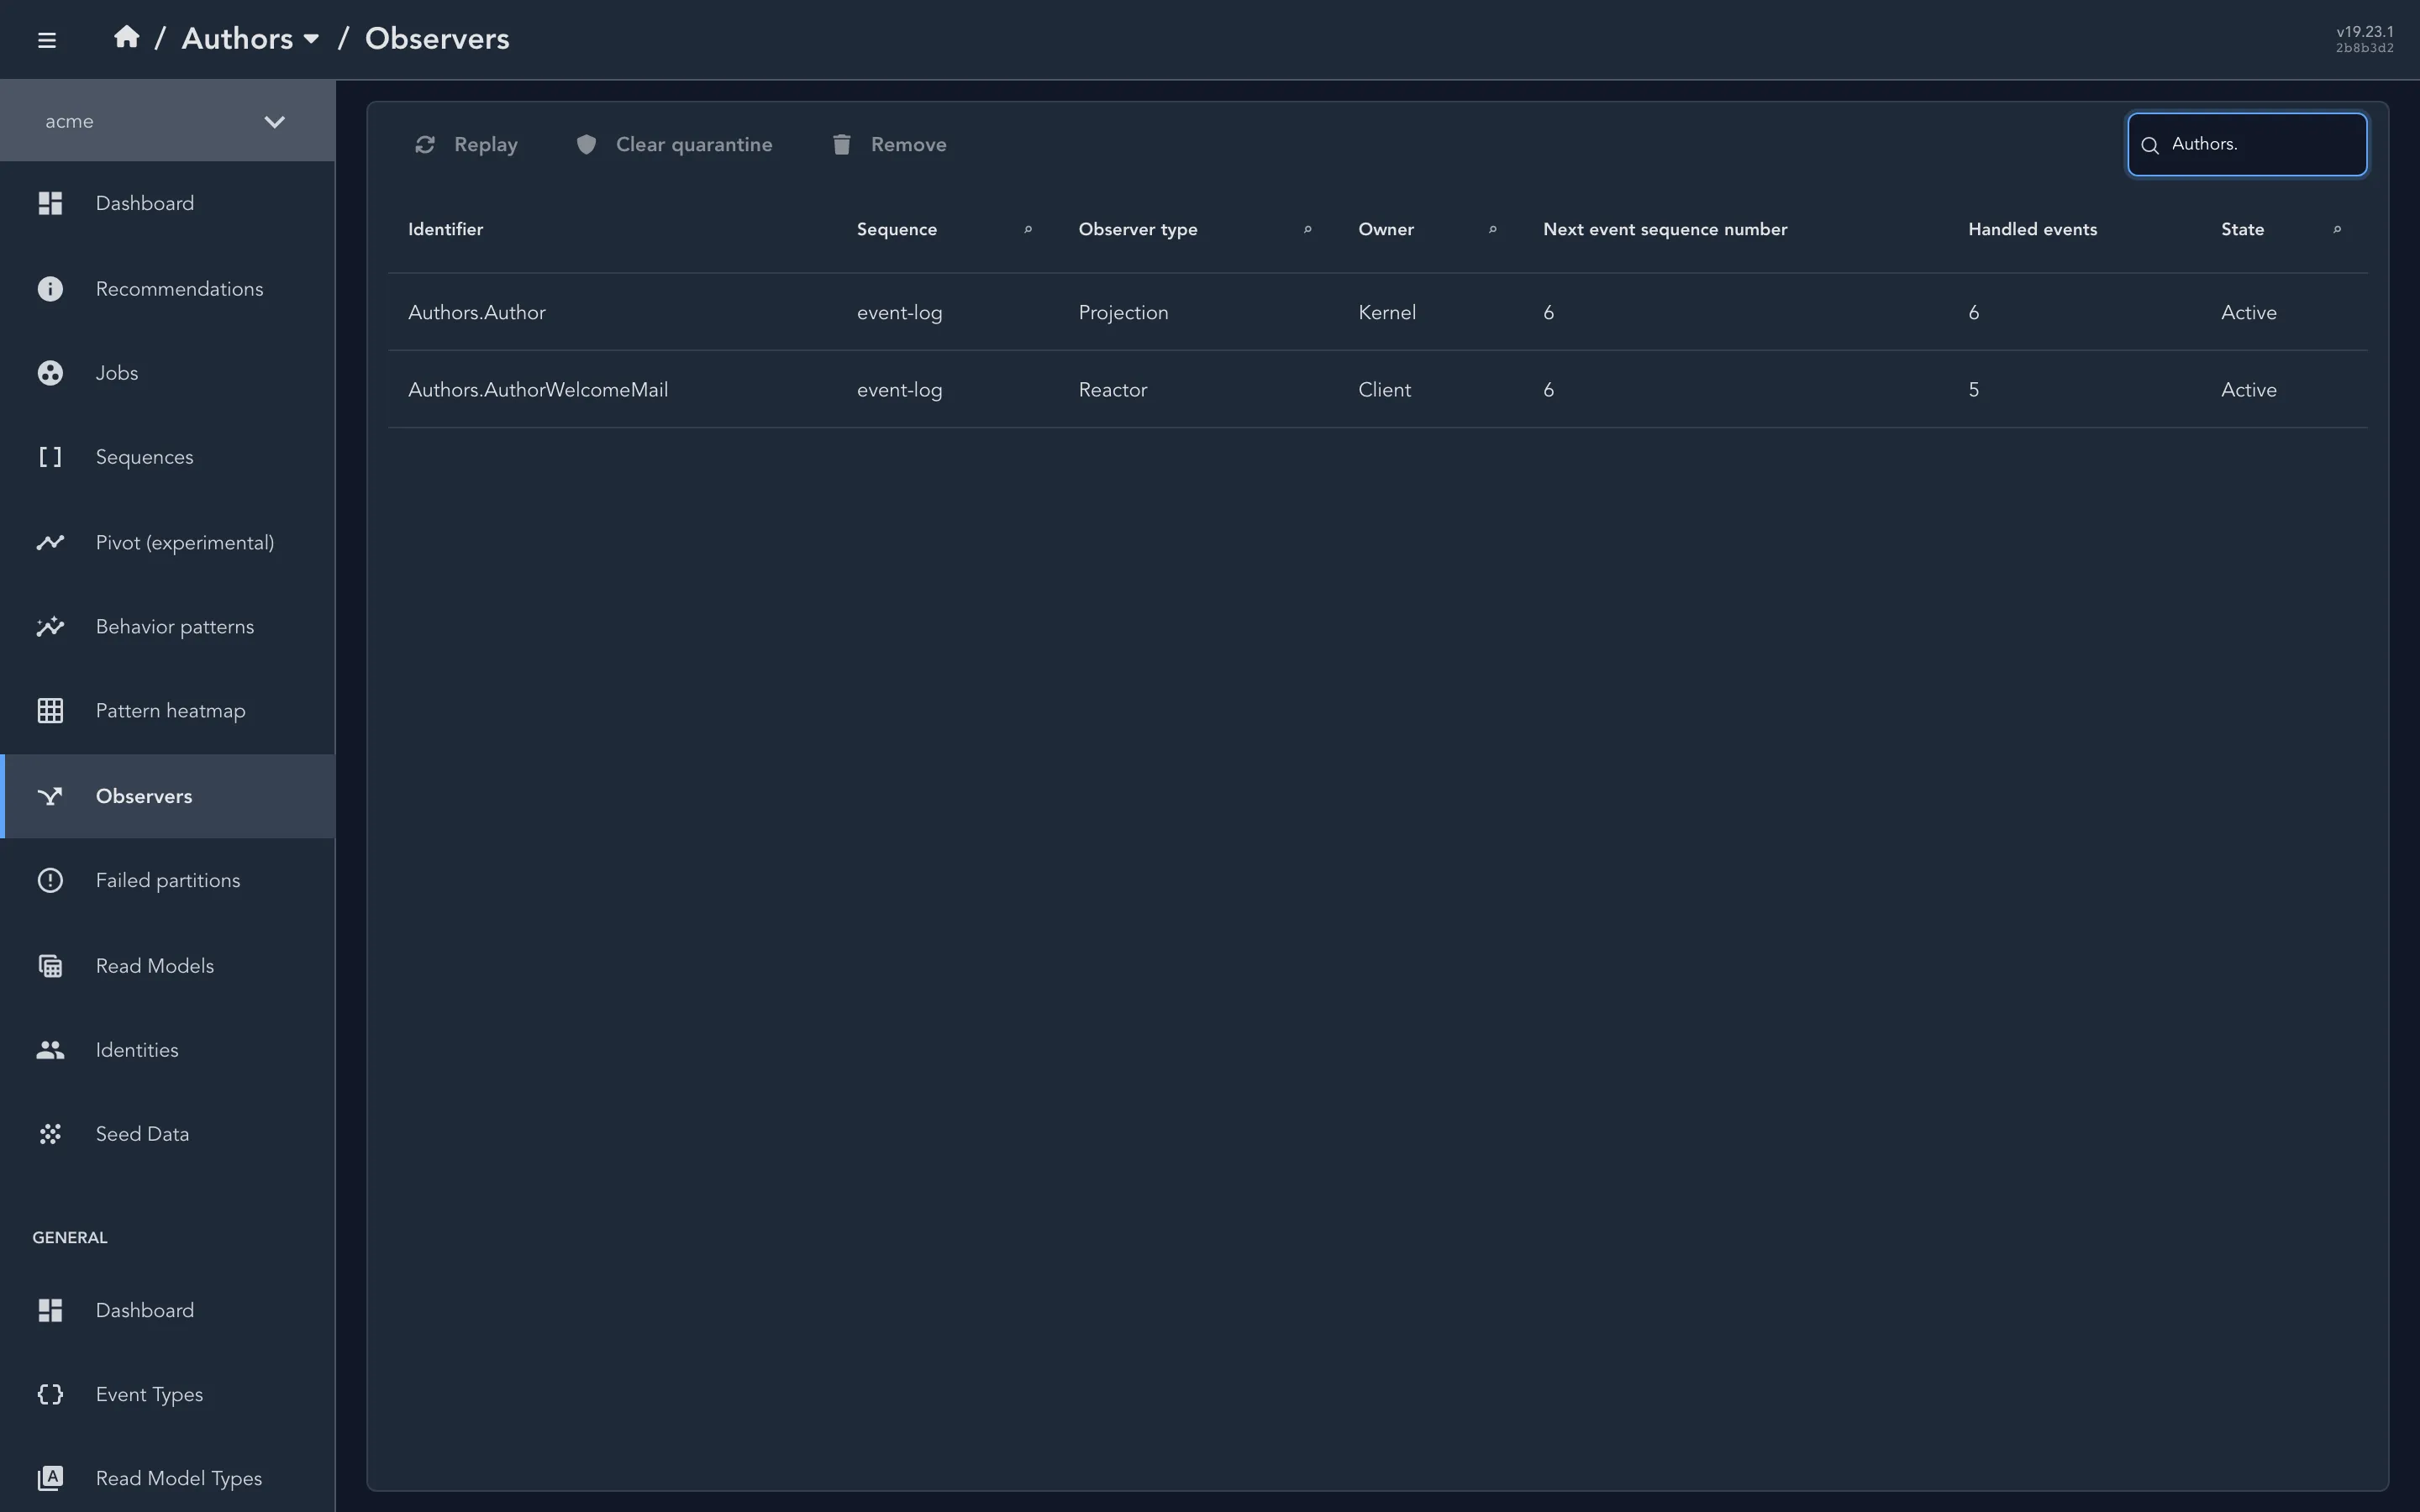
Both rows read Active. The reactor has a failed partition, and the list doesn’t show it.
An observer’s position doesn’t say whether it’s healthy, because one that has stopped consuming looks exactly like one with nothing to do. The Failed partitions page answers that.
The observer’s detail view has a connected clients section in its Summary tab, with each client’s connection, type, version, machine, process ID and process. When a client was last seen is on the Connected Clients page. An observer with no connected client has nobody to deliver events to. That’s the normal state while the application is stopped, and the first thing to check when it’s supposed to be running.
Why it failed
Section titled “Why it failed”When a partition fails, Chronicle stops that partition and retries it with backoff, and the observer’s other partitions carry on. A partition is the events of one event source, so for the author feature it’s one author, and the failed partition is labelled with the author’s ID. You can go straight from “this author is missing” to the partition that holds the reason.
The Failed partitions page lists each one with its status, the partition, the number of attempts and the last attempt, and it has a detail panel per partition. Status says whether the partition has been quarantined. When the status value is missing, the page shows Unknown, and that’s a gap in what the page knows about the partition. It doesn’t mean the partition is fine.
Inside Chronicle explains the failure kinds that separate a handler bug from congestion. The detail panel lists each attempt’s time, sequence number, messages and stack trace. As of Chronicle 19.23.1 it doesn’t show the kind.
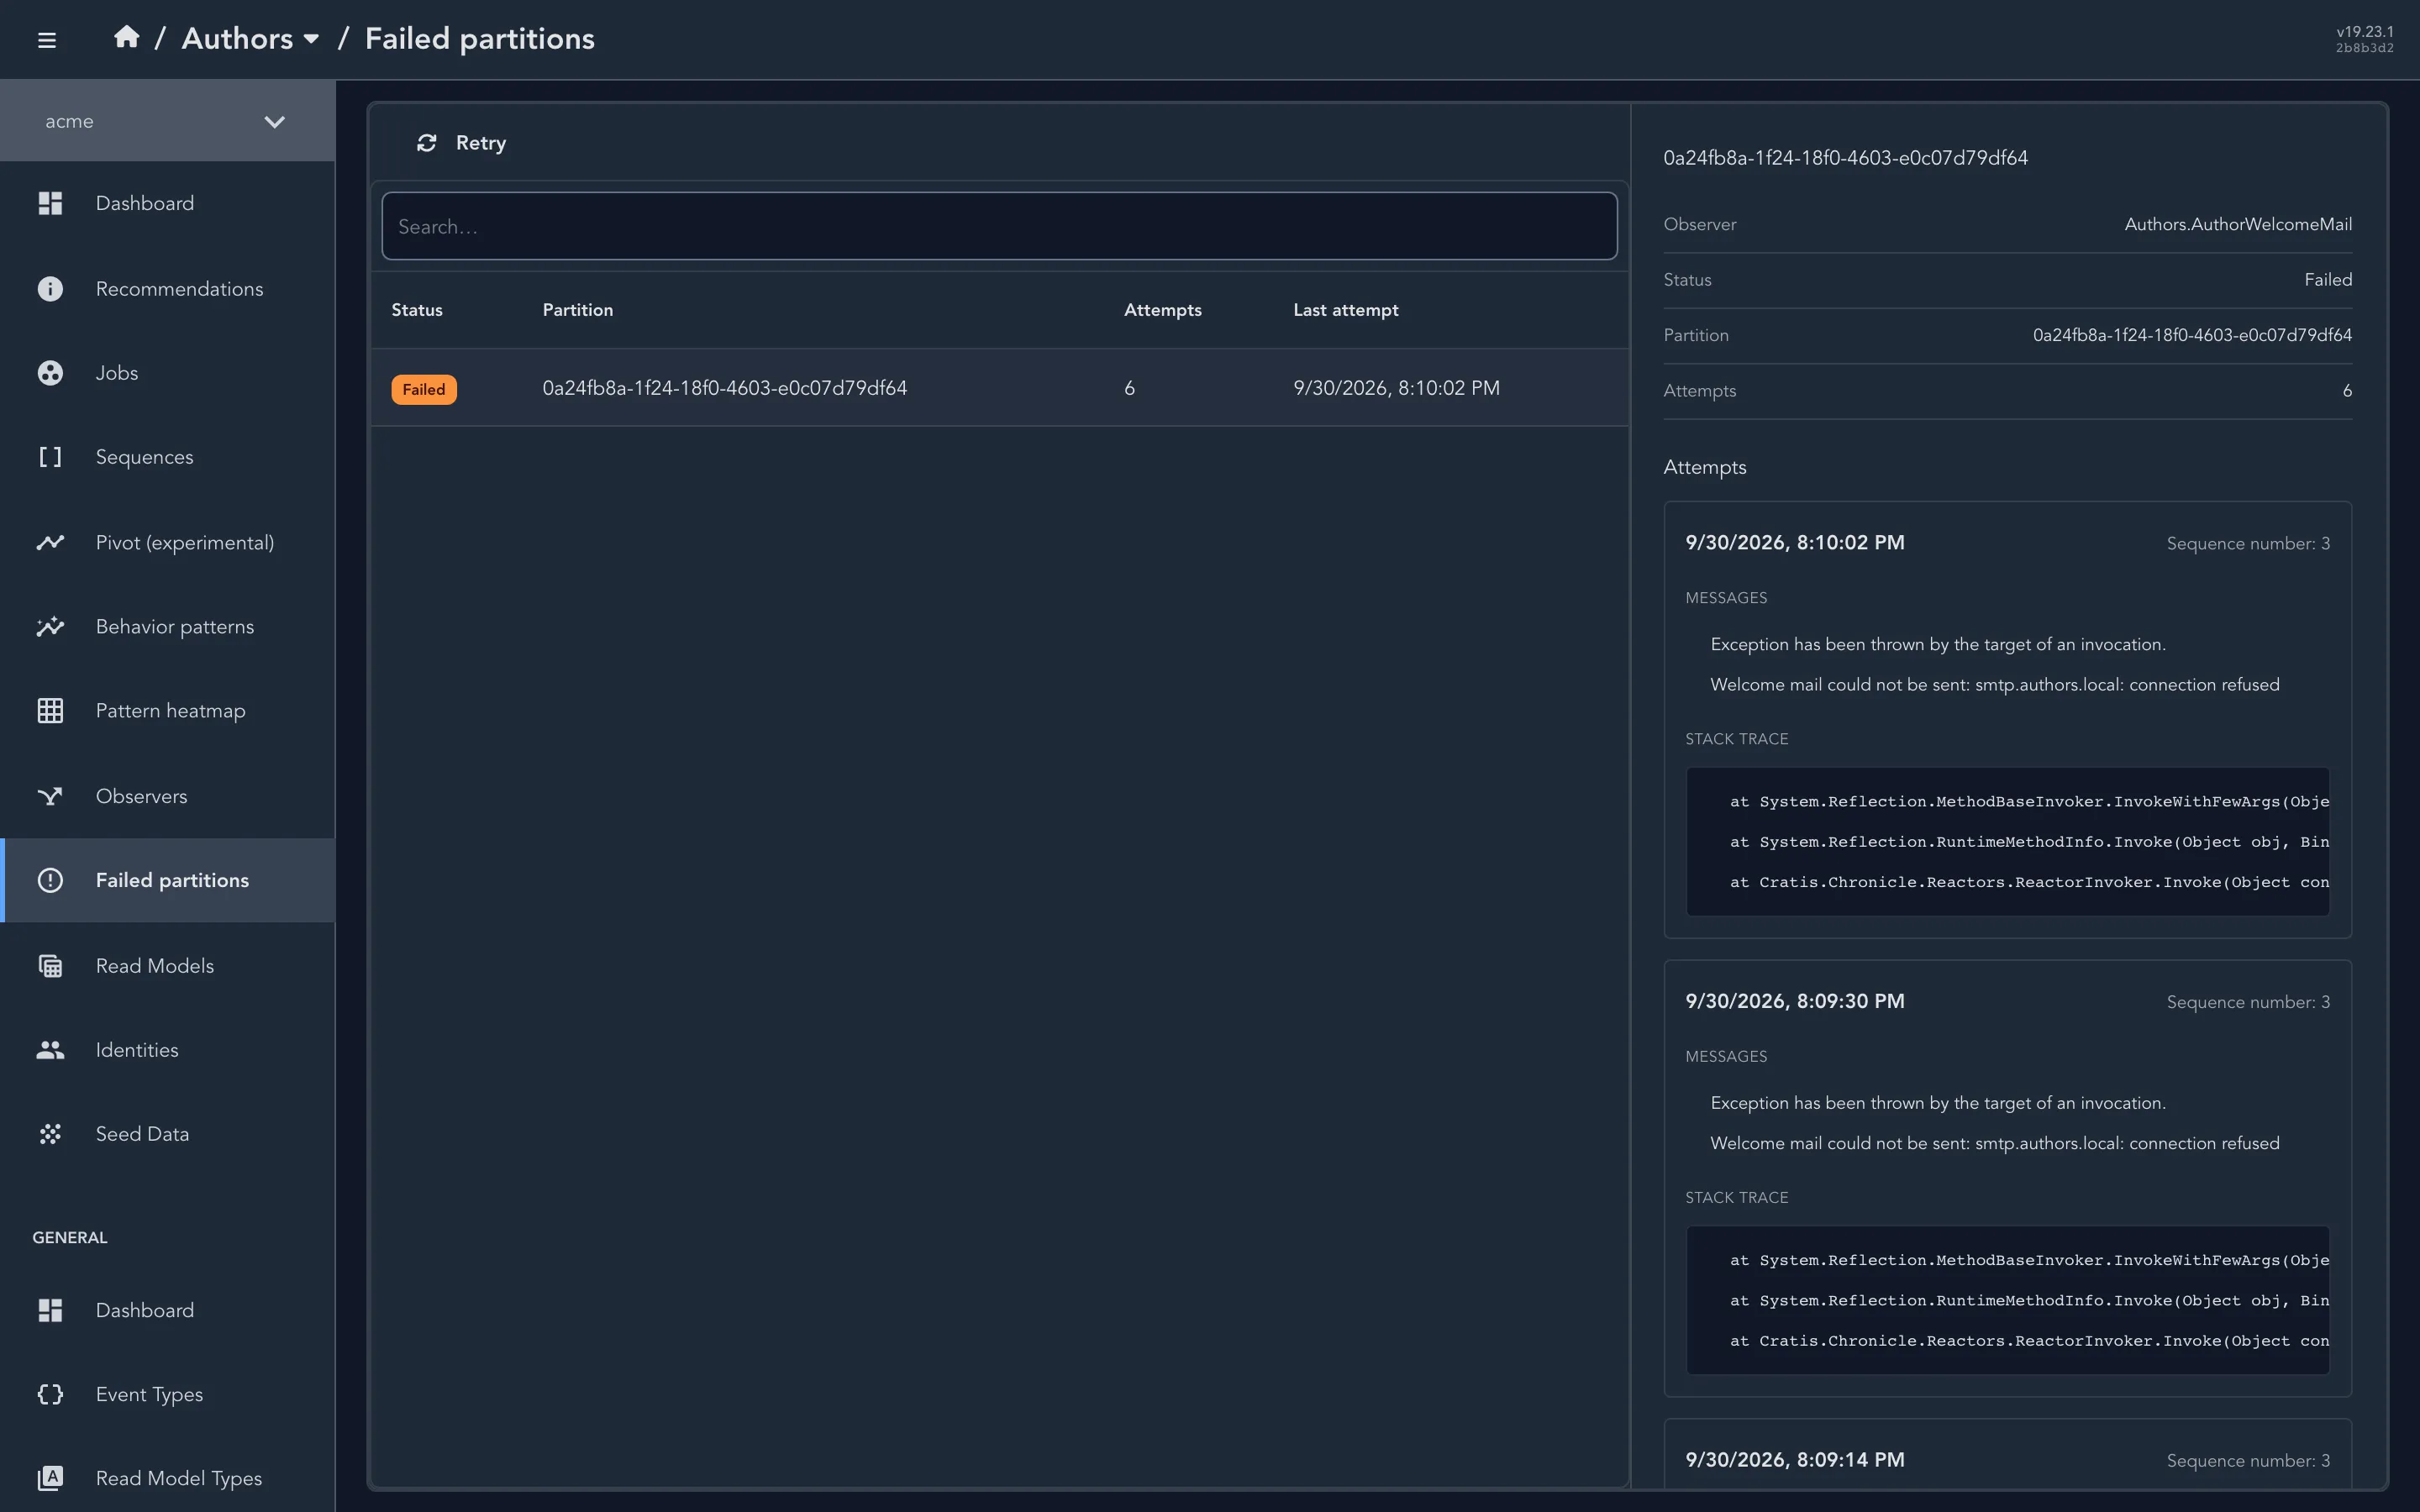
A failed partition’s detail: one entry per attempt, with its messages and stack trace.
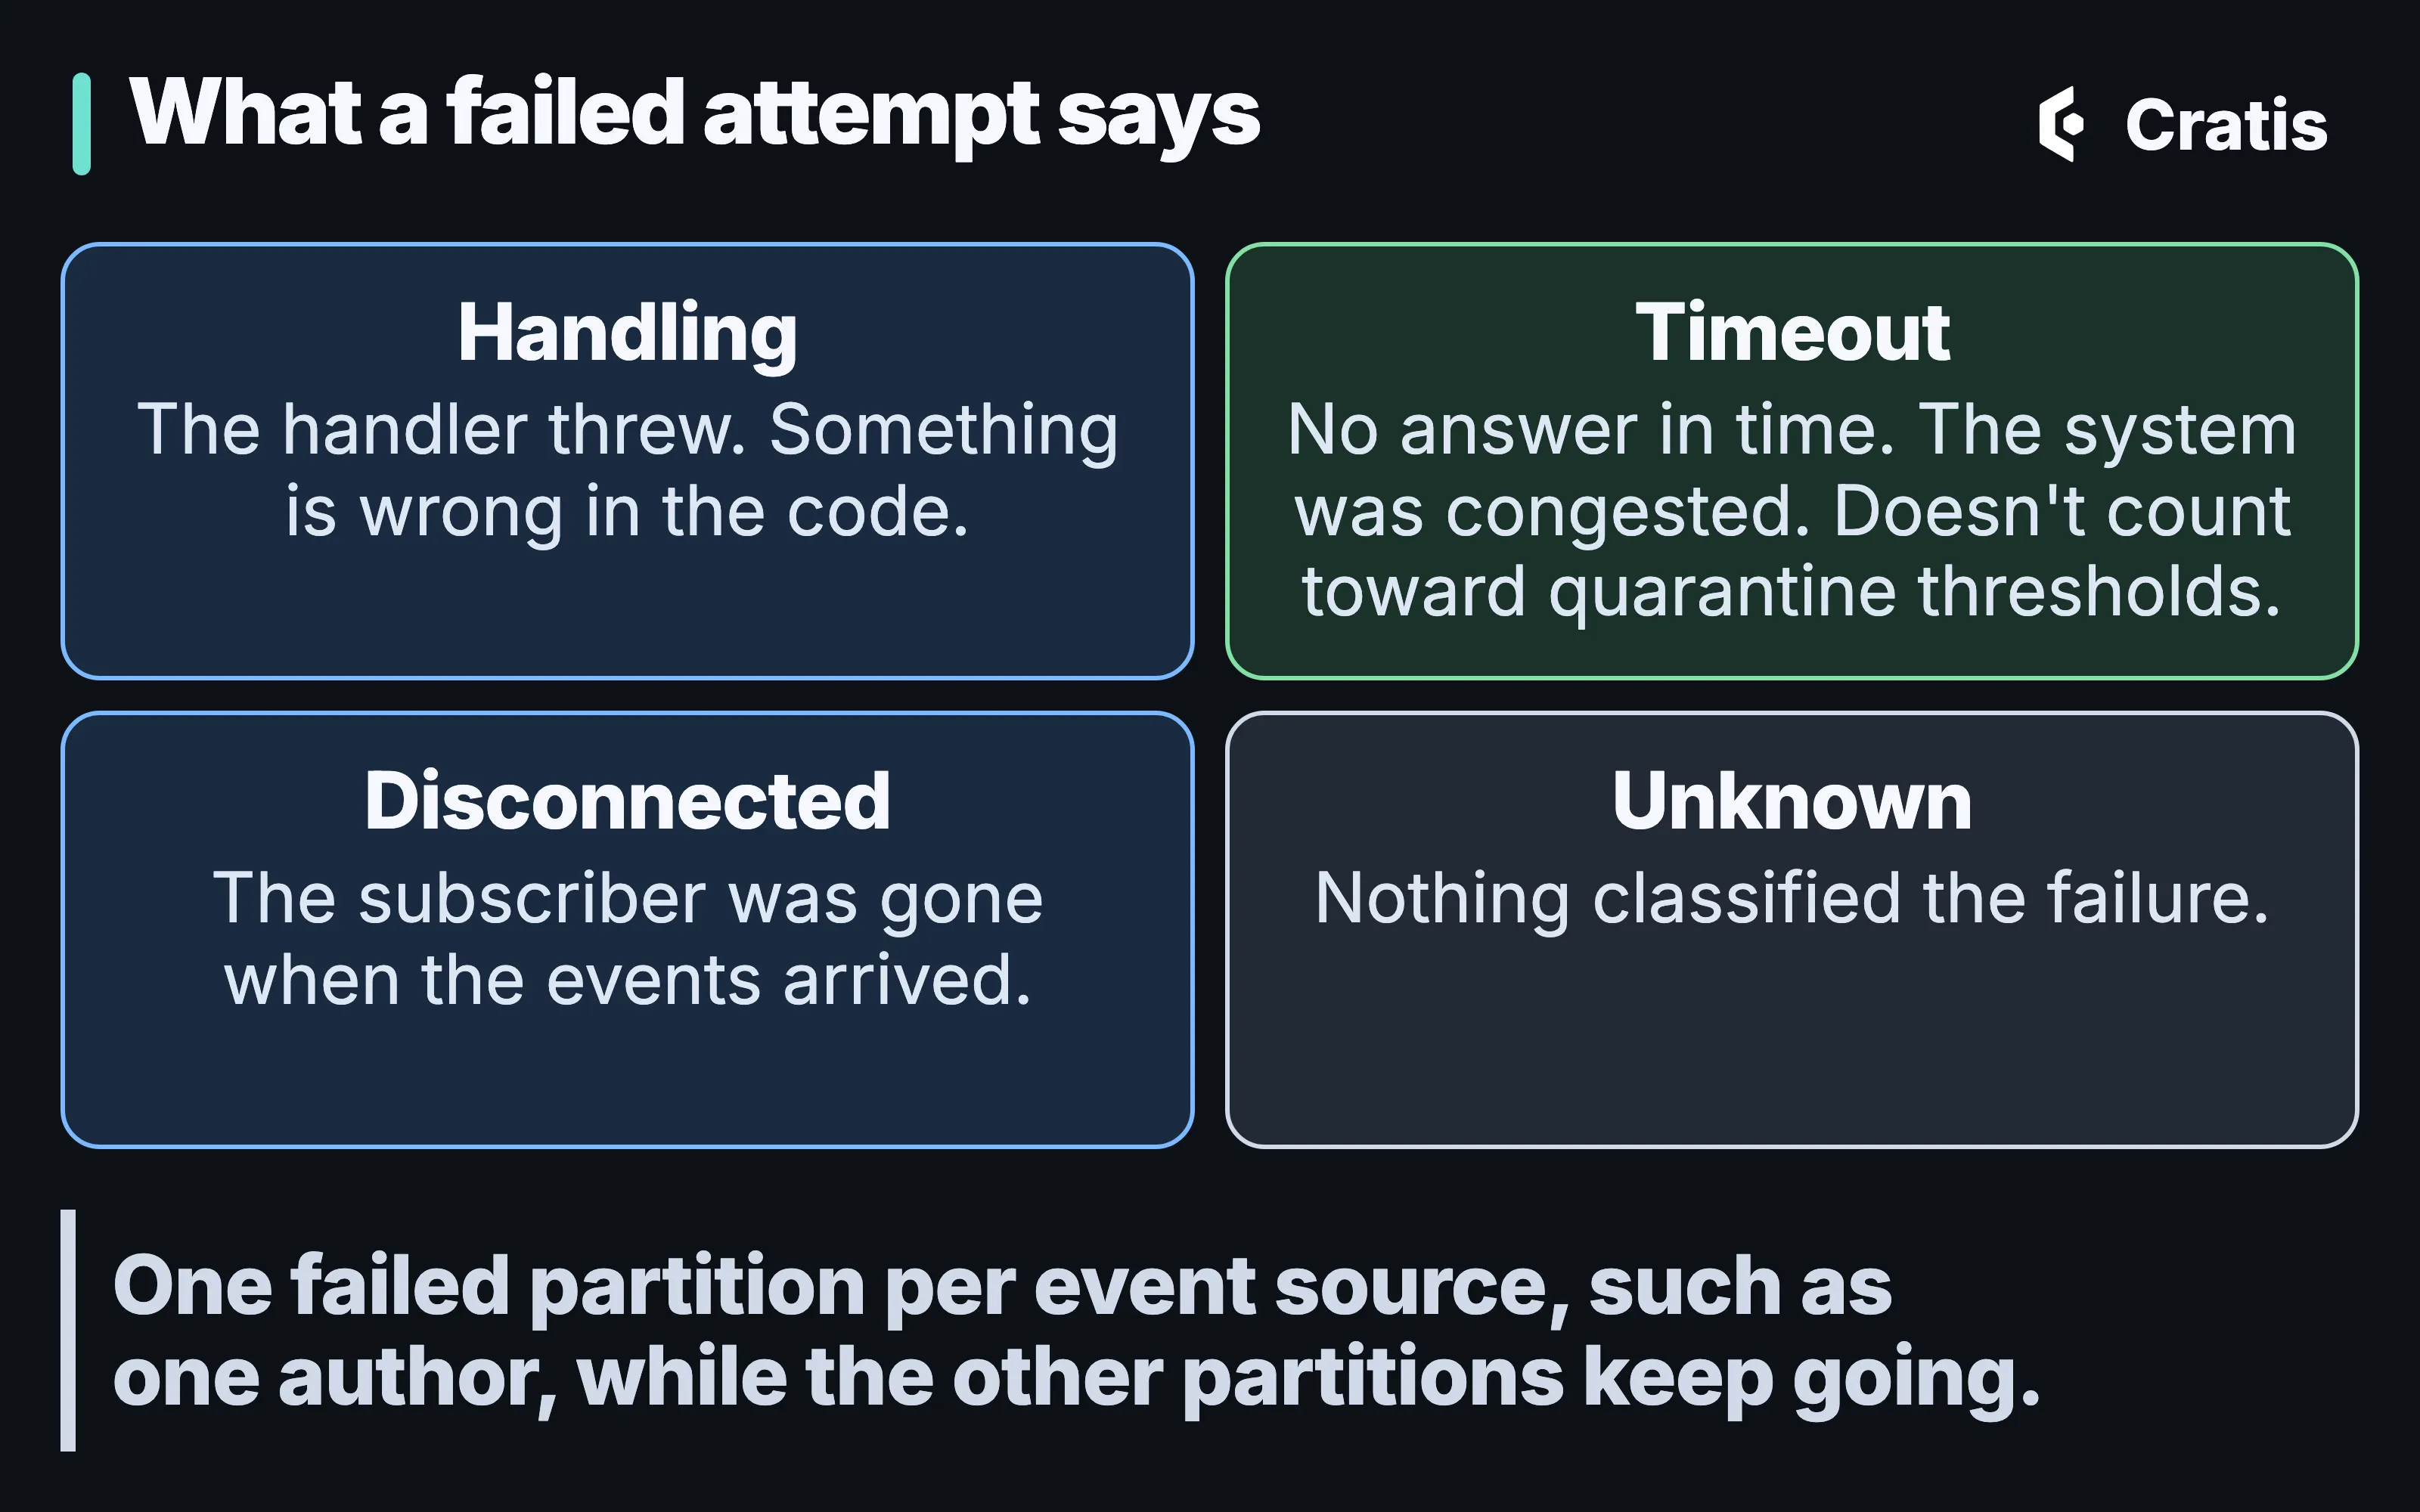
The kind of an attempt separates a bug from congestion.
The retry policy and the timeout exception to observer quarantine are covered in Inside Chronicle.
The page itself has one action, Retry, which asks for one more attempt at that partition. Fixing the cause comes first, because a retry against the same bug fails the same way.

Fix the cause, press Retry, and the partition leaves the list.
What the view actually holds
Section titled “What the view actually holds”The Read models page lists the read-model definitions in the namespace, their occurrences by generation, and a paged list of the instances in each. For the missing author, look for the author’s ID among the Author instances. When an instance exists but holds old content, the time machine shows the snapshots of that one instance, so you can see how its state got to where it is.
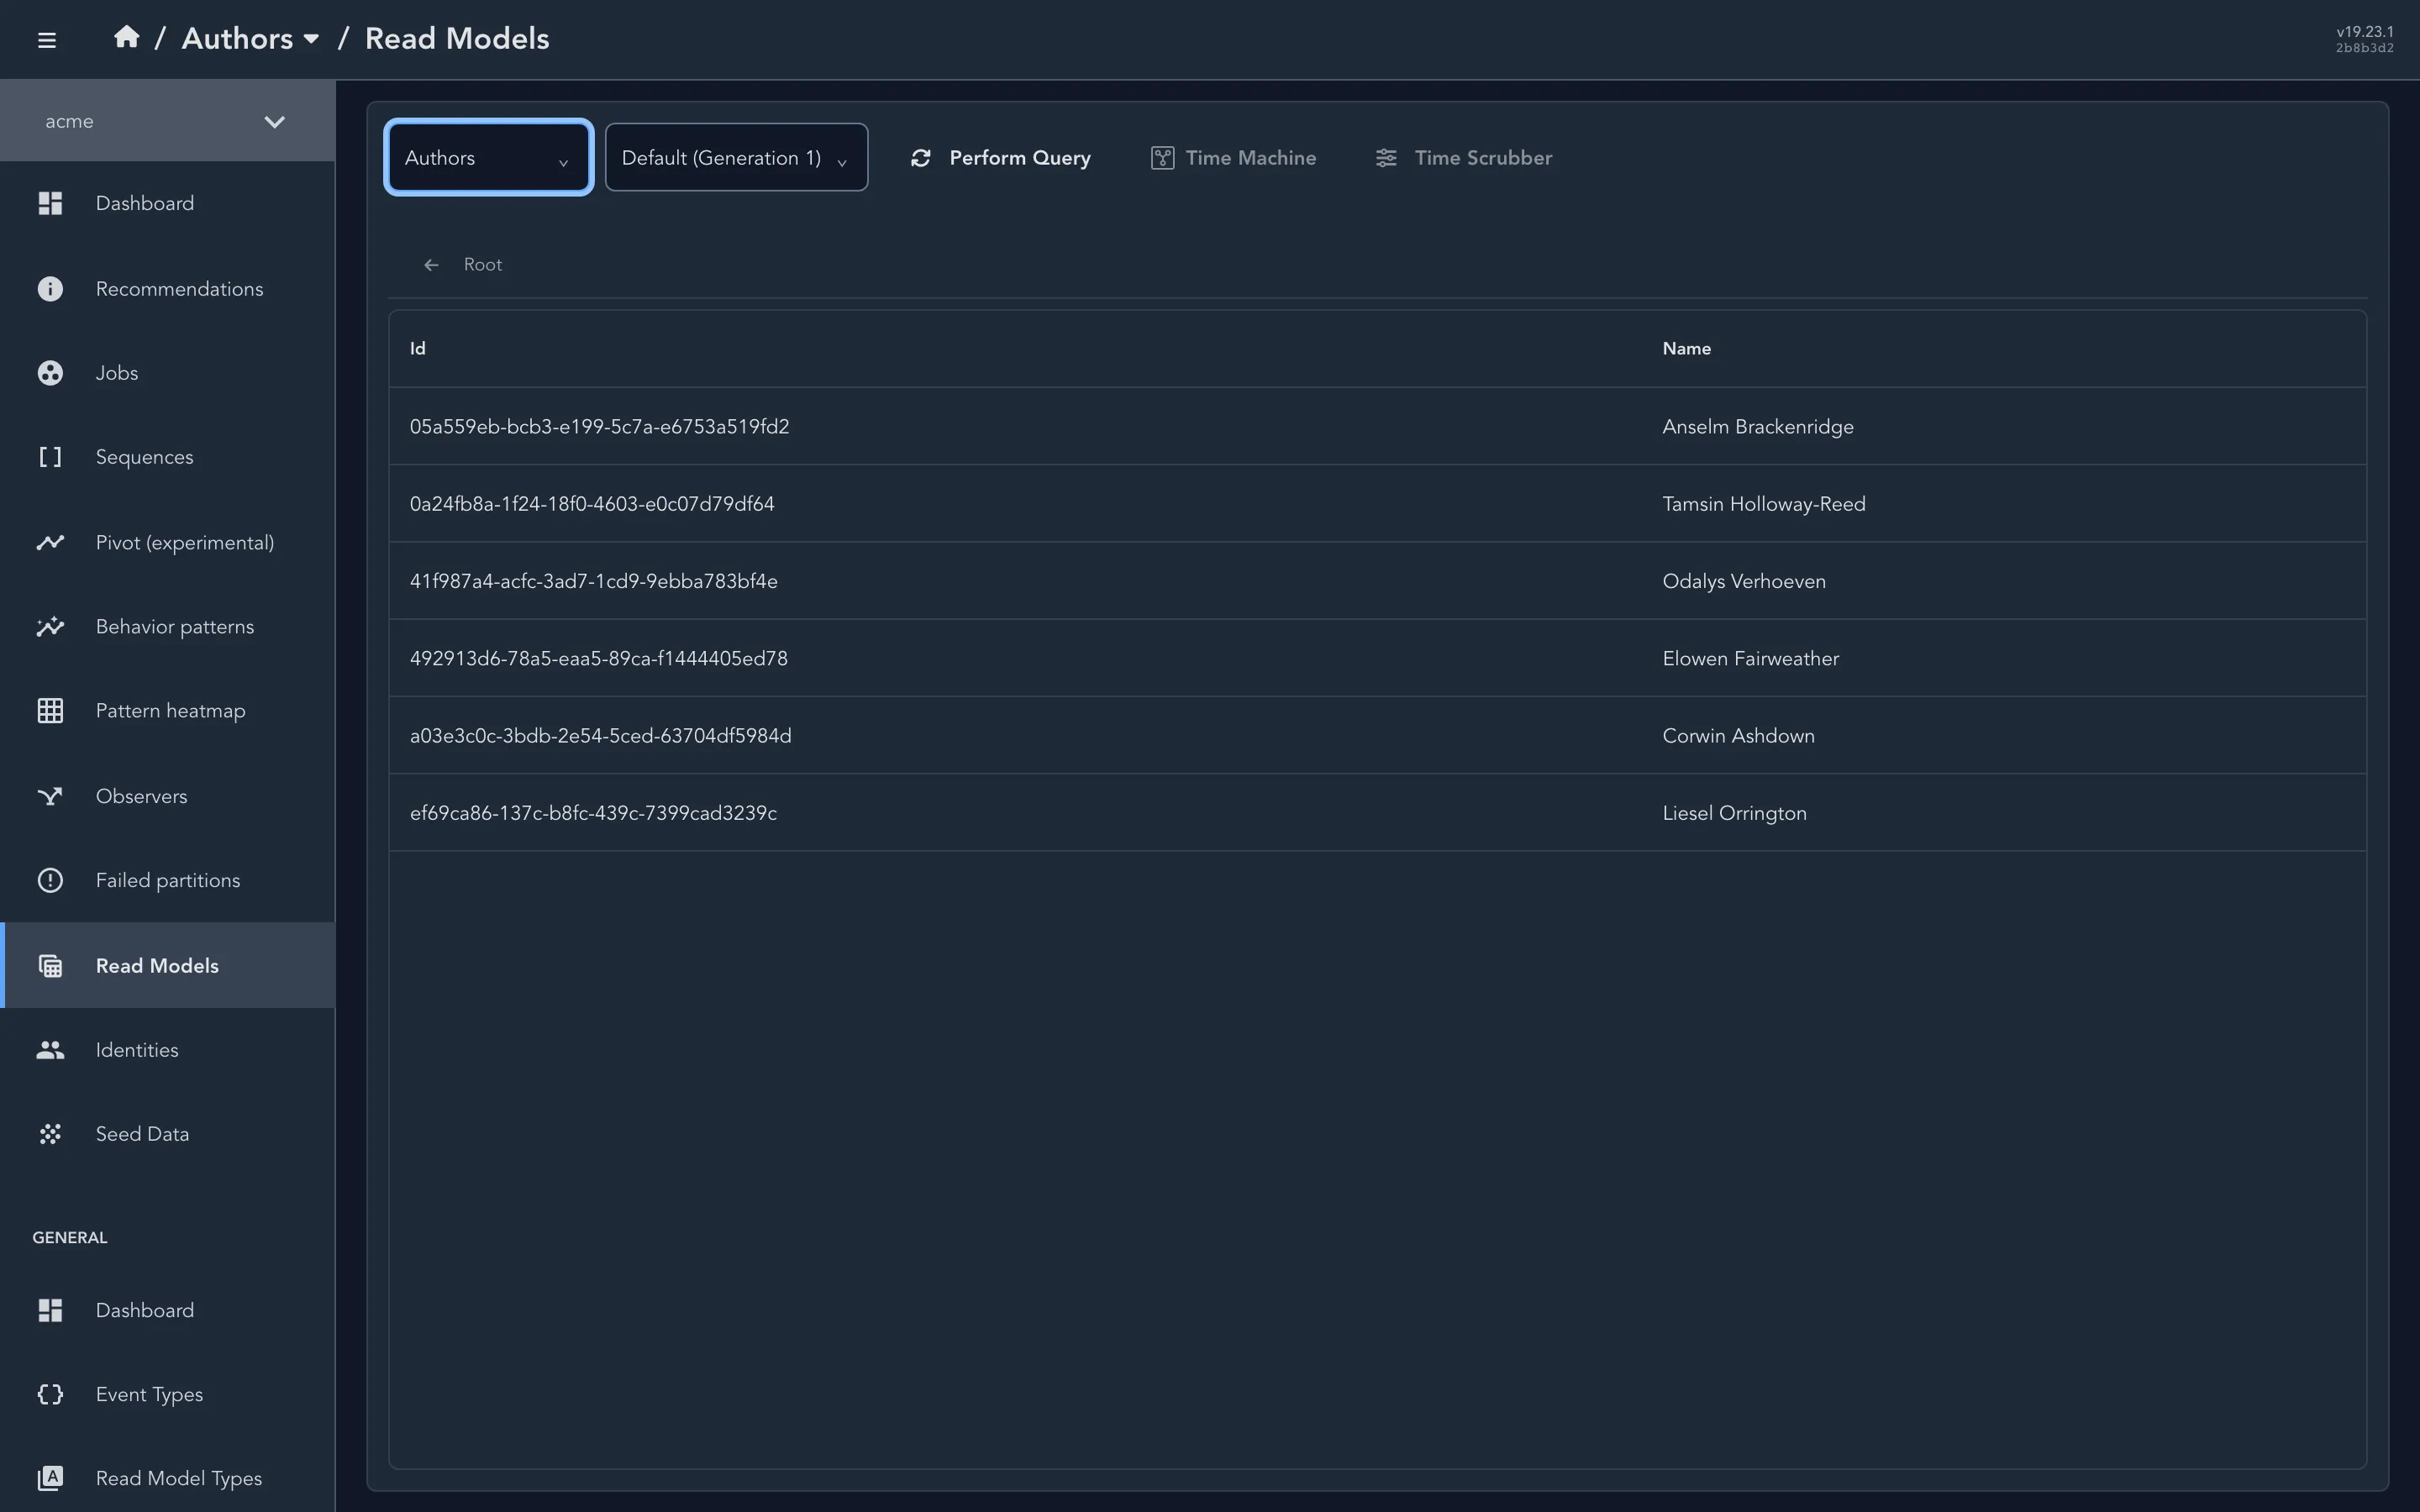
The instances of a read model in one namespace.

From one event to the read-model instance built from it.
Projection definitions live at store level, on the projections page, with an editor and a preview. The preview shows how a projection will behave for the features it supports, so a change to the Author projection can be tried there first, within what the preview covers. What happens when a changed definition is deployed, and why Chronicle sometimes replays and sometimes only recommends it, is in Jobs, scale and performance.
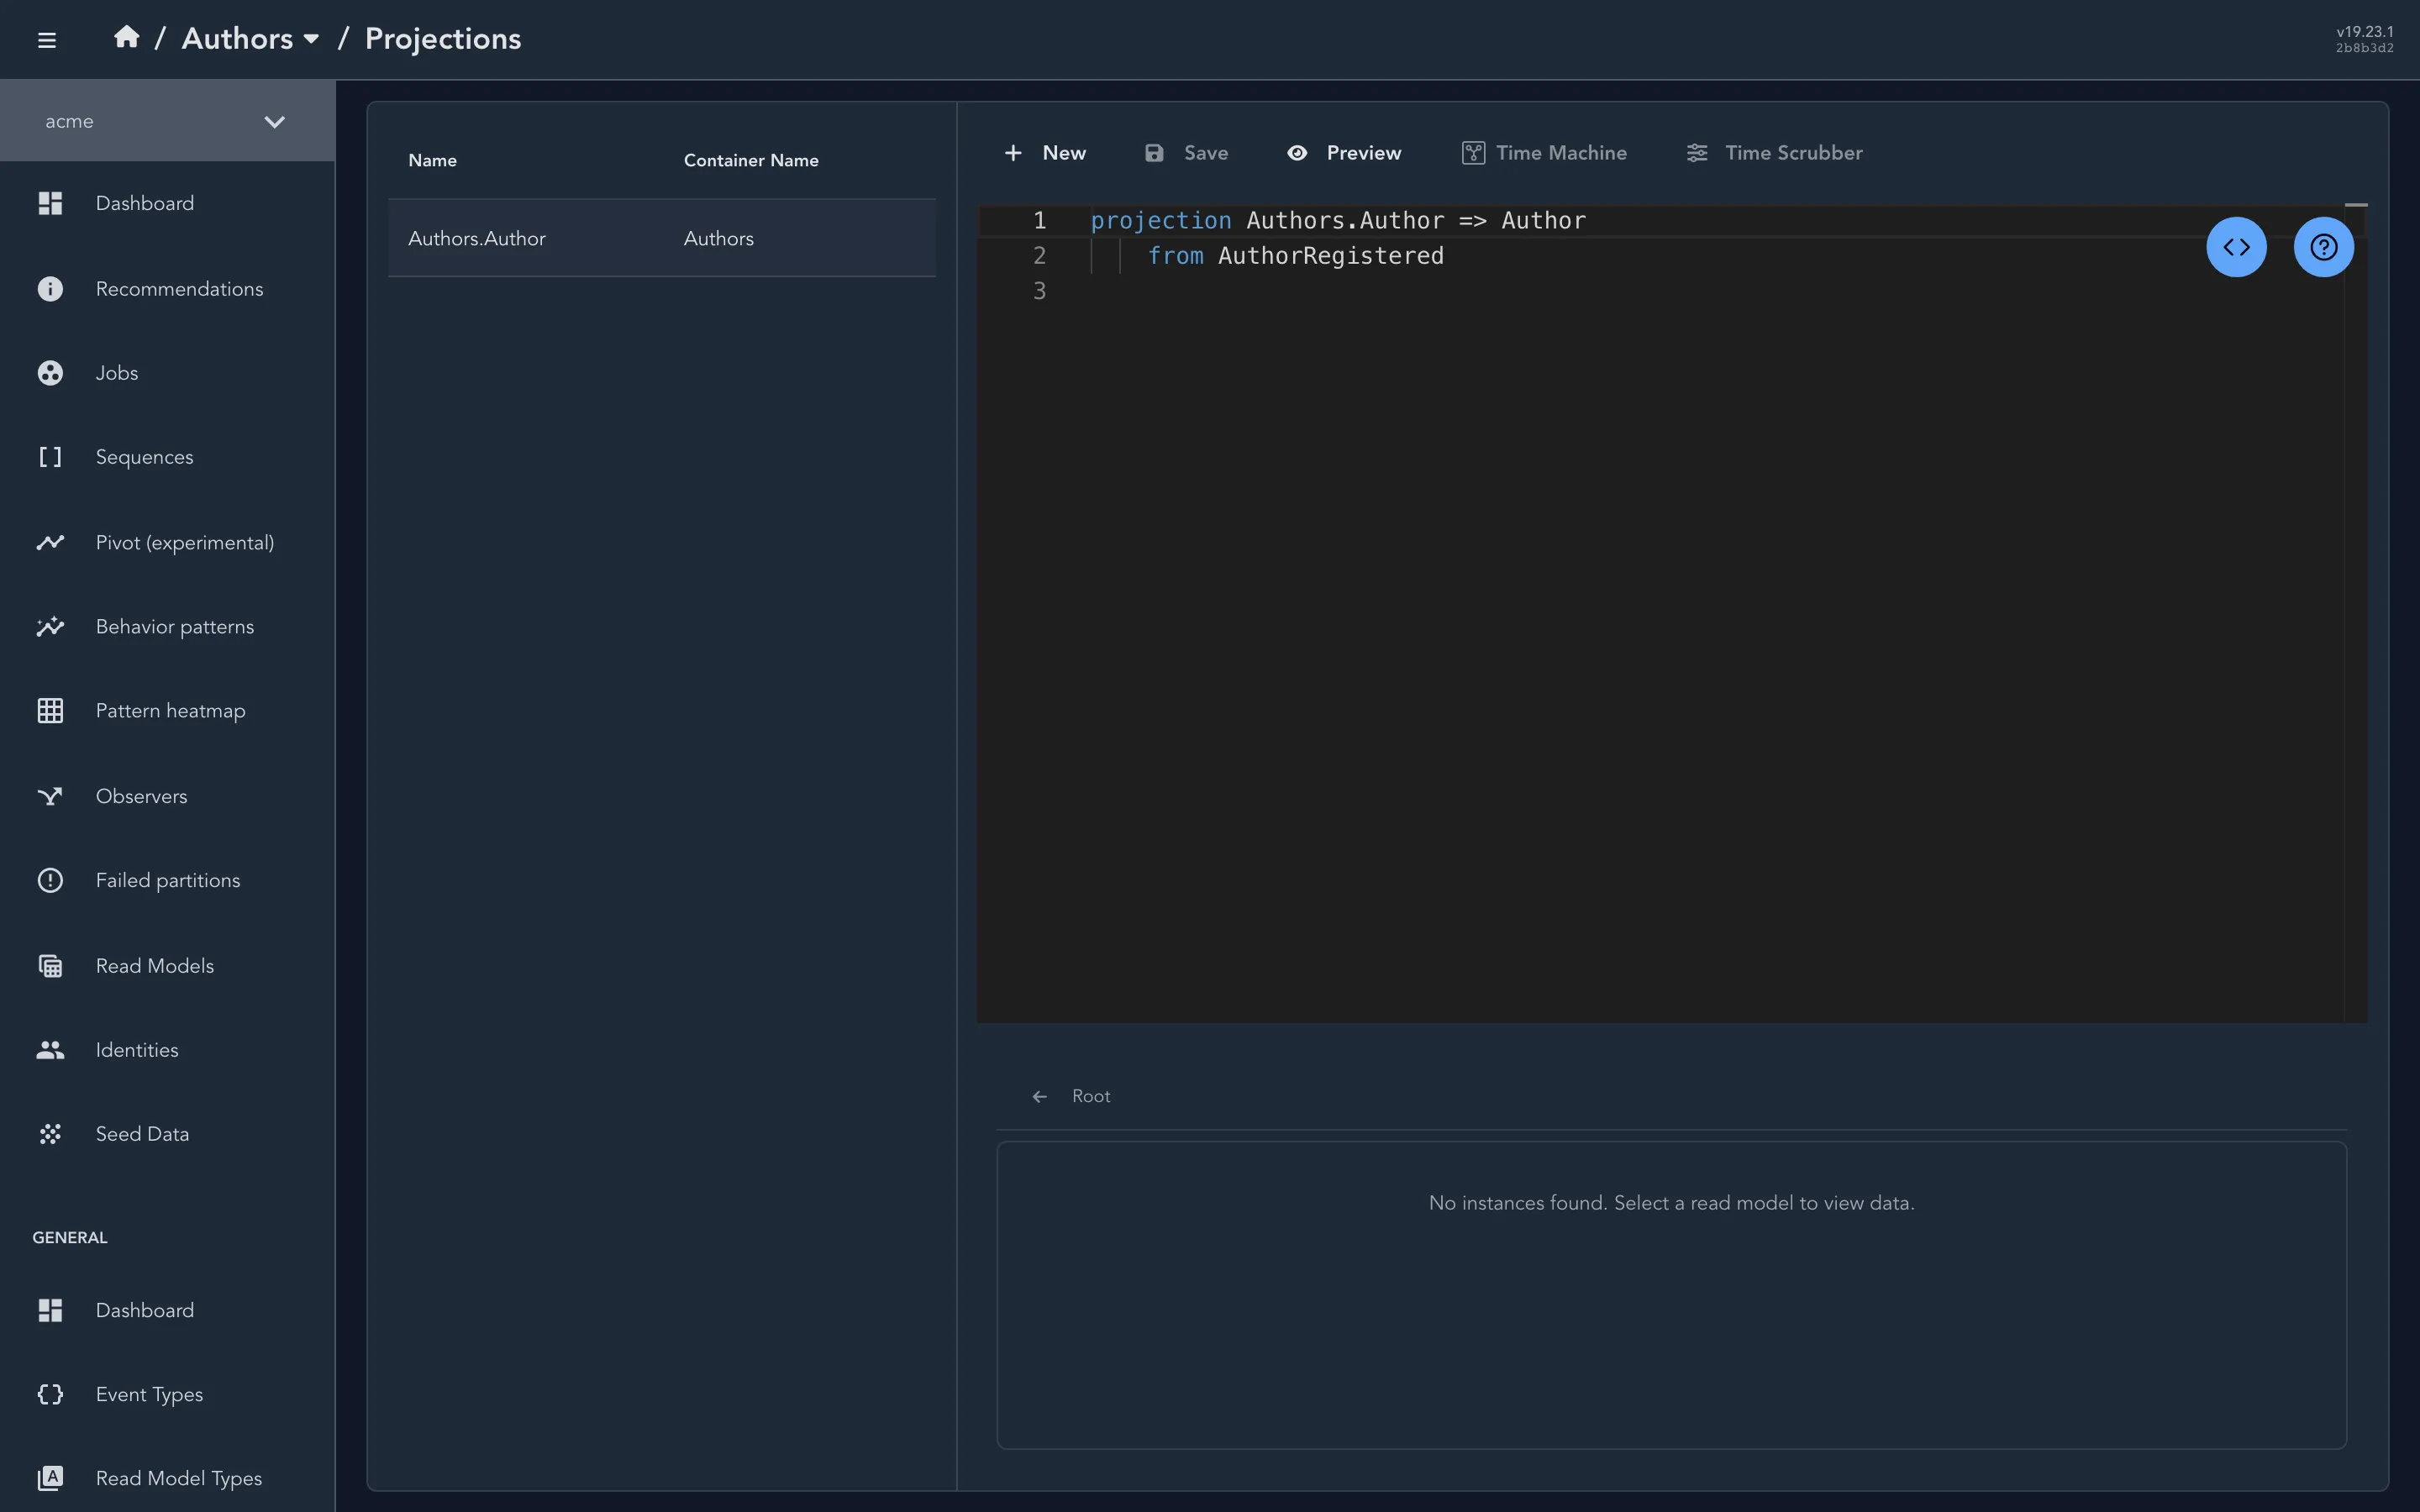
A projection’s declaration in the editor.
Around the edges
Section titled “Around the edges”The dashboard gives key figures, a distribution of events by type and a breakdown by namespace. The Jobs page shows replays, catch-ups, migrations and failed-partition retries with their type, status and progress. The Recommendations page shows the replays Chronicle has filed for a person to decide on, each with a name, a description and when it occurred.
The other store-level pages aren’t on the missing author’s route: read-model types, known identities, webhooks, external services, captures and a page that seeds events into a store.
Above the stores, the Servers page lists each server’s address, status, CPU and memory. It’s where a cluster with more than one node shows up, and it doesn’t show which node runs which partition. The other system screens list users, OAuth applications and connected clients, and development builds add a page of development tools.
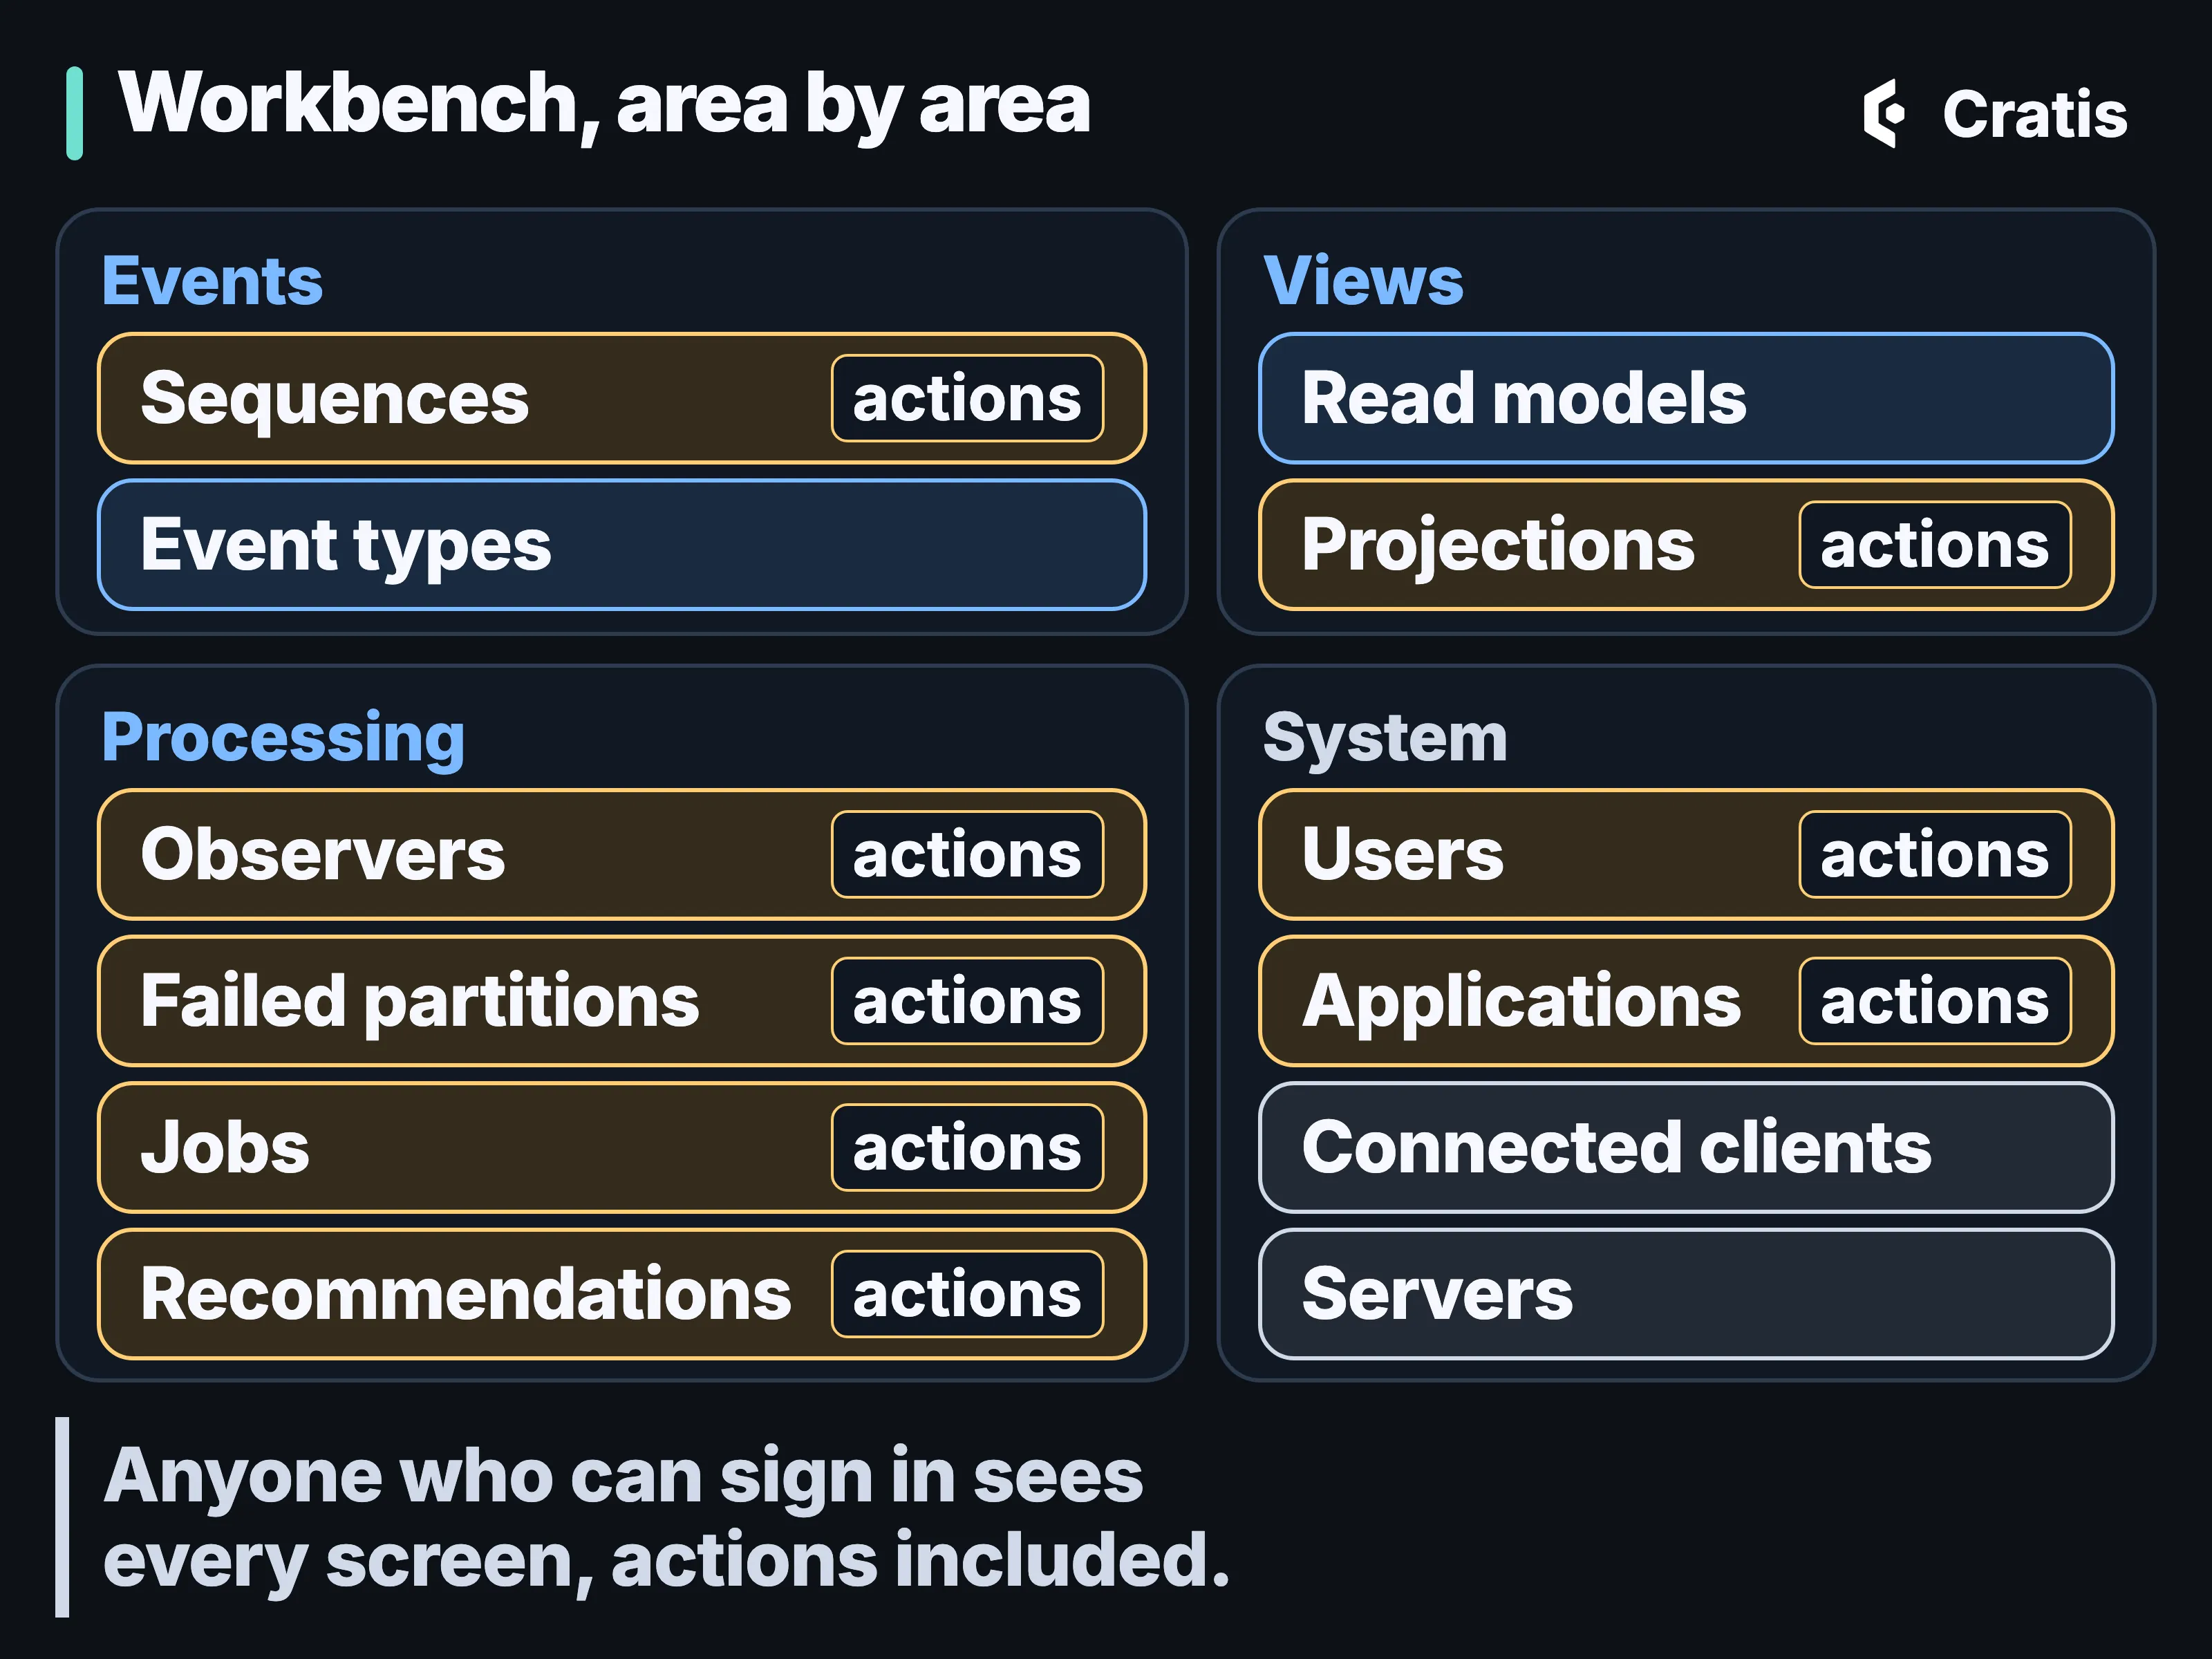
The Workbench’s main screens, and which ones carry actions.
Screens that change things
Section titled “Screens that change things”Several screens have buttons that change the store. On Sequences you can append an event, revise one, or redact a single event or every event of one event source. Observers has Replay, Clear quarantine and Remove. Jobs has Stop, Resume and Delete. On Recommendations, Perform replays the observer the recommendation names, and Ignore drops it. The seed-data page writes events, the projections page saves definitions, the system screens add and remove users and OAuth applications, and the store-level pages remove webhooks and external services and stop or delete captures.
Some of those buttons reach further than they look. Removing an observer is refused while any client is subscribed to it in any namespace. Once it goes through, it applies to every namespace and leaves the read-model data where it is, and if the observer registers again later, it replays from the start of the log. A replay rebuilds from sequence zero, which on a large store takes time. A revision keeps the original next to the correction, and redaction replaces an event’s content with a marker in the same slot. Year two goes through what each kind of correction means.
The Workbench is built for looking at a running Chronicle and previewing projections. It isn’t a full administration console, and nothing about its buttons makes a change on a production store reviewed or safe. Behind the screens there’s also no role model. Anyone who can sign in gets every screen, the ones that change things included, and the password-change prompt on first login doesn’t restrict anything else they can call. Workbench has screens for revising and redacting events. Being able to open a tool or run a command isn’t permission to use it on a production system.
The browser or the terminal
Section titled “The browser or the terminal”The Workbench is served by the server, behind the server’s authentication. On a machine you reached over SSH, cratis chronicle workbench opens a full-screen terminal dashboard over the CLI’s connection instead. It has views for observers, failed partitions, jobs, recommendations, event sequences, event types, projections and read models, plus the server-level lists, and each action goes through a confirmation dialog. It has no screens for appending, revising or redacting events, and no projection editor. The Cratis CLI covers it with the rest of the CLI.
The CLI’s cratis chronicle diagnose reports failed partitions in one summary and names the next command to run. The two work well side by side. The terminal says that a partition failed, and the Workbench shows the observer, its clients and the instance it was supposed to update.
From VS Code, Narrator, which we still treat as experimental, browses the same stores and only reads.
Follow the missing author from the event on the Sequences page to the observers listed on its event type, then to the failed partition labeled with the author’s ID and the error its attempts recorded. The Author instance on the Read models page shows what the list was actually reading. The fix goes into the code, and whether anyone presses Retry afterwards, on a production system, is a decision for whoever runs that system.