

From script to stage · Part 19: Chronicle jobs, scale and performance

Cratis: from script to stage, and the long run · Part 19 of 26
Replaying a projection in Chronicle runs as a job, and a job can be stopped halfway and resumed later from where it stopped, as long as the application that owns the observer is connected. If the server crashes instead, the replay picks up from its last checkpoint, and the batches it processed since that checkpoint are delivered a second time.
Change the projection behind the Author read model and deploy it, and Chronicle decides whether the change needs a replay. The job’s progress and the cost of restarting it matter once that author list has a long history.
What runs as a job
Section titled “What runs as a job”A job is long-running work the kernel does in the background, split into steps. These are the kinds it runs as of Chronicle 19.23.1:
| Job | What it does |
|---|---|
| Replay observer | Reprocesses an observer from the start of the log |
| Replay observer partition | Reprocesses one partition of an observer |
| Catch up observer, catch up partition | Brings an observer or one partition up to the tail, after downtime, a new subscription or a full queue |
| Retry failed partition | Makes one more attempt at a failed partition |
| Migrate existing events for type | Back-fills a new generation of an event type across the stored events |
| Reindex constraints | Rebuilds a constraint’s index after its definition changed |
A replay isn’t split the same way for every observer. A projection’s replay is a single step that reads the log in global order, from the first event to the last. A reducer’s or reactor’s replay is one step per event source, taken from the observer’s index of keys, so for the author feature that’s one step per author.
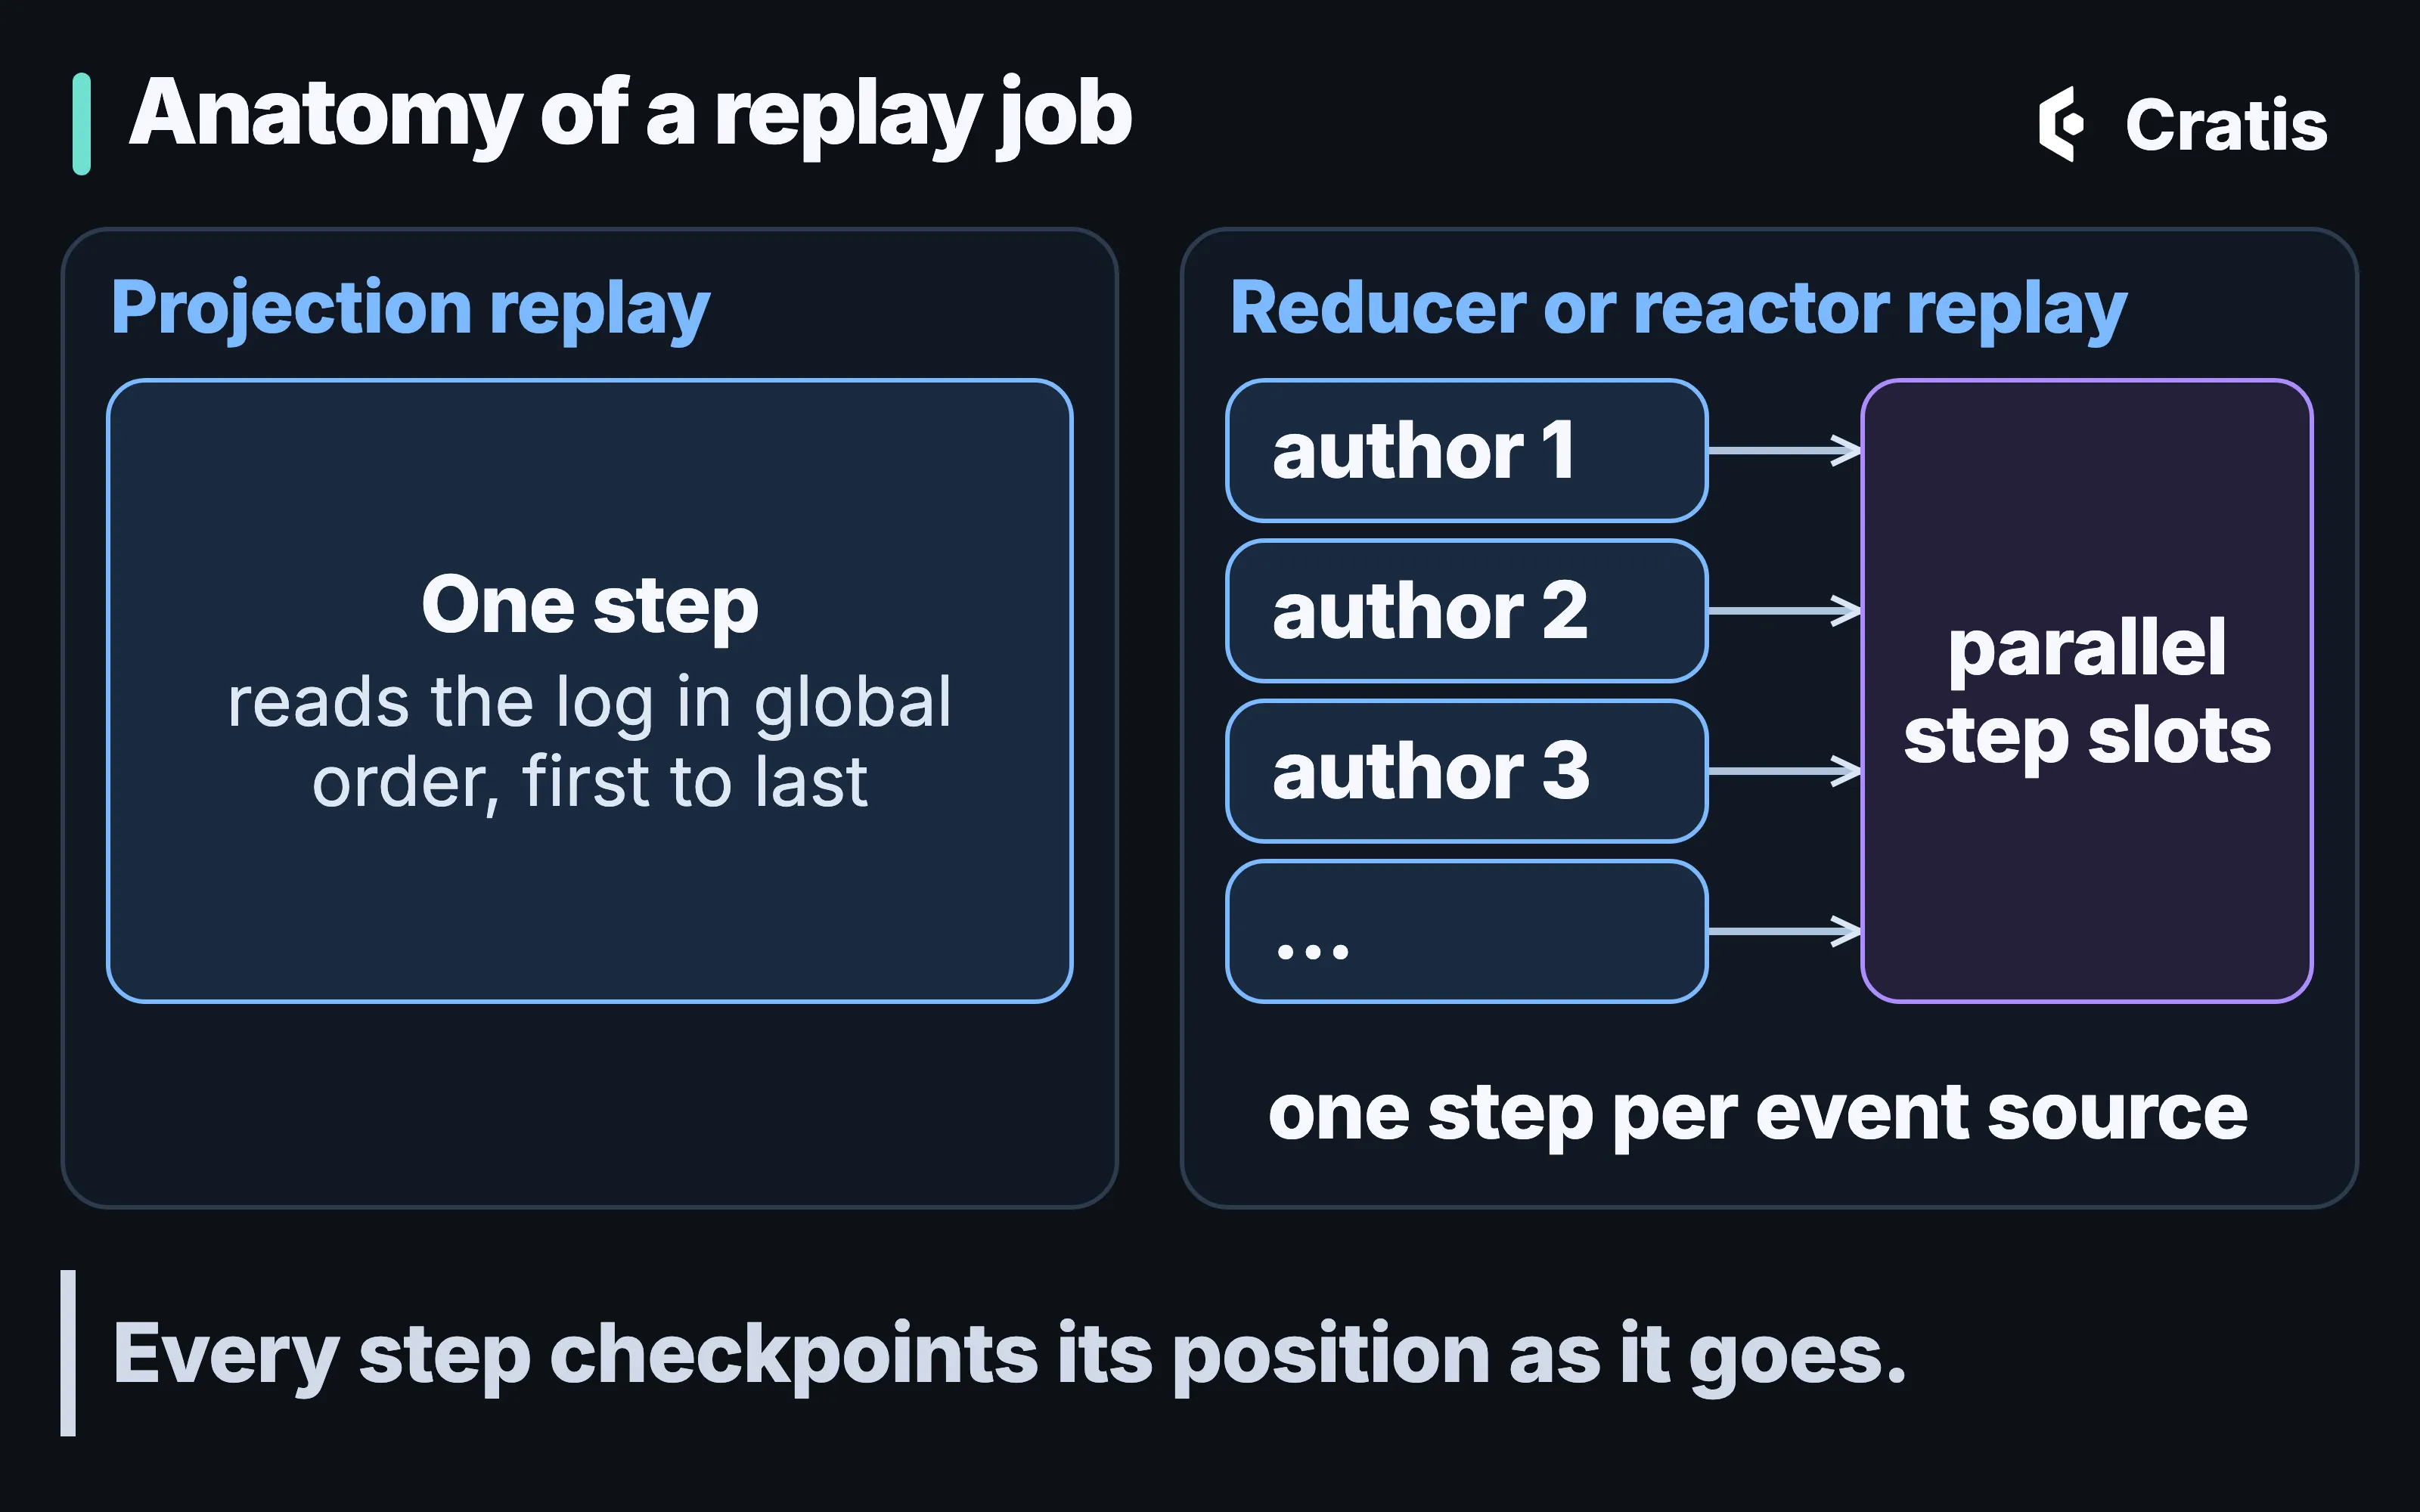
A projection replays in one ordered step; a reducer or reactor replays one event source per step.
Two operations that sound like background work aren’t jobs. Erasing a person’s key is a synchronous call from the client, and webhooks are delivered by an observer.
A job’s life
Section titled “A job’s life”A job moves through PreparingJob, PreparingSteps, StartingSteps and Running, and ends as CompletedSuccessfully, CompletedWithFailures, Stopped or Failed. Removing is the state it passes through on its way out. Each step has a status of its own, from Scheduled and Running through to completed, stopped or failed.
The controls are stop and resume. Stopping keeps the job’s progress, and resuming a stopped job continues where it left off. A job that ended as Failed doesn’t resume.
Stop and resume have two rules for replays. Resuming a replay needs the observer to be subscribed, so a replay you stopped can’t continue while the application is down. And starting a replay deletes the observer’s other jobs, so a stopped replay doesn’t survive the next one.
The kernel cleans up after itself on a schedule. A job stuck in preparation with no steps is removed after an hour. Every 60 seconds a watchdog checks that running replay and catch-up jobs are still making progress, and an observer that stays stuck preparing a catch-up is quarantined after five recovery attempts.
Jobs belong to an event store and a namespace, like the observers they work for.
What a crash delivers twice
Section titled “What a crash delivers twice”A replay or catch-up step doesn’t write its position after every event. It makes a checkpoint durable every 100 batches or every five seconds, whichever comes first, and on every status change. After a crash, the step resumes from its last checkpoint and reads forward again, so everything between that checkpoint and the crash is delivered a second time.
For a projection that only sets values, a second delivery writes the same values again. For one that accumulates, such as a count, it would change the result. Chronicle narrows that in two ways. For read models keyed by the event source ID, the sink write is guarded by a watermark by default, so a batch that was already applied isn’t applied again. A projection that combines several event sources into one document, through a join, a constant key or a parent, can’t be guarded that way. Its per-partition steps checkpoint after every batch, which keeps what’s read again to the batch in flight, and that doesn’t make it idempotent.
Reactors have no such guard, and they don’t need a special case either. Chronicle can deliver an event to an observer more than once. A timeout, a retry and a replay can all deliver an event again, so a reactor has to cope with running twice regardless, and a crash during a job is one more way that happens. For the author feature, a reactor that sends a welcome email needs to know whether it already sent one. Reacting to facts goes through delivery identity and [OnceOnly].
How many steps run at once
Section titled “How many steps run at once”Job throttling caps the number of job steps running in parallel. Each step takes a slot before it runs, waits in a queue when none is free, and gives the slot back when it finishes, successfully or not. The default is the processor count minus one, with a minimum of one, so an 8-core machine runs up to seven steps at a time.
In chronicle.json it goes at the top level:
{ "Jobs": { "MaxParallelSteps": 4 } }As an environment variable, it’s Cratis__Chronicle__Jobs__MaxParallelSteps=4. Don’t nest the section under Cratis and Chronicle inside chronicle.json. Chronicle already publishes that file under the Cratis:Chronicle: path, so a nested copy binds to the wrong path and is silently ignored.
There’s a second ceiling in the kernel’s own code. The effective cap is the smaller of MaxParallelSteps and Observers.MaxConcurrentPartitions, which defaults to 32 and isn’t in the configuration reference. On a machine with 34 or more cores the default stops tracking the processor count, and a configured value above 32 is capped at 32 as well.
For the author feature, that cap matters for reducers and reactors, whose replays are made of many small steps. A projection’s replay is one step, so the cap doesn’t speed it up.
Watching and steering jobs
Section titled “Watching and steering jobs”The Workbench’s Jobs page shows each job’s type, status and progress, with Stop, Resume and Delete. The terminal workbench has a Jobs view where S and U stop and resume. From the CLI:
cratis chronicle jobs listcratis chronicle jobs get <JOB_ID> -o jsoncratis chronicle jobs stop <JOB_ID> # progress is preserved; needs --yes non-interactivelyjobs get shows each step with its own progress and any error. The CLI has no command to delete a job. Chronicle MCP has three tools for stopping, resuming and deleting jobs, and they’re the only tools in it that change anything on the server. Chronicle MCP can read personal data and isn’t read-only, so scope what you connect it to. The jobs API lists jobs and their steps, stops, resumes and deletes them, and the .NET client exposes it as IJobs.
Replays Chronicle recommends instead of running
Section titled “Replays Chronicle recommends instead of running”The classification and definitionEvolution policy in From event to read model determine whether a changed definition starts a job or leaves a recommendation. To let partial replays run while reserving full ones for a person:
{ "observers": { "maxRetryAttempts": 10, "definitionEvolution": "PartialOnly" } }As of Chronicle 19.23.1, a recommendation is always a replay candidate. It’s filed for a projection or reducer definition change the policy didn’t apply, for a reactor or webhook definition change when replayOnDefinitionChange is off, and for a retired projection that wrote to the same container as the one replacing it. Performing a recommendation replays the observer server-side and removes the recommendation when the replay succeeds. Ignoring it drops it.
We’d set PartialOnly or Manual on a store where a full replay of a large projection is expensive, so that a deploy doesn’t start one on its own and a person decides when it runs.
How events reach observers
Section titled “How events reach observers”An append doesn’t wait for observers. Once an event is in the log, it’s handed to observers through queues, and the number of queue loops is events.queues, 2 by default. It’s the setting to raise for higher expected event throughput, and it comes without a sizing rule.
Each queue is a bounded channel, 2,000 batches by default, set by Events.QueueBoundedCapacity in the kernel’s configuration code. When a channel is full, the append still doesn’t wait. The observers on that queue are moved to their catch-up path, which reads the log again from each observer’s persisted position, and catching up is a job like the others. Setting the capacity to 0 makes the channel unbounded, and then nothing is ever moved. The setting isn’t in the configuration reference, so treat it as an internal.
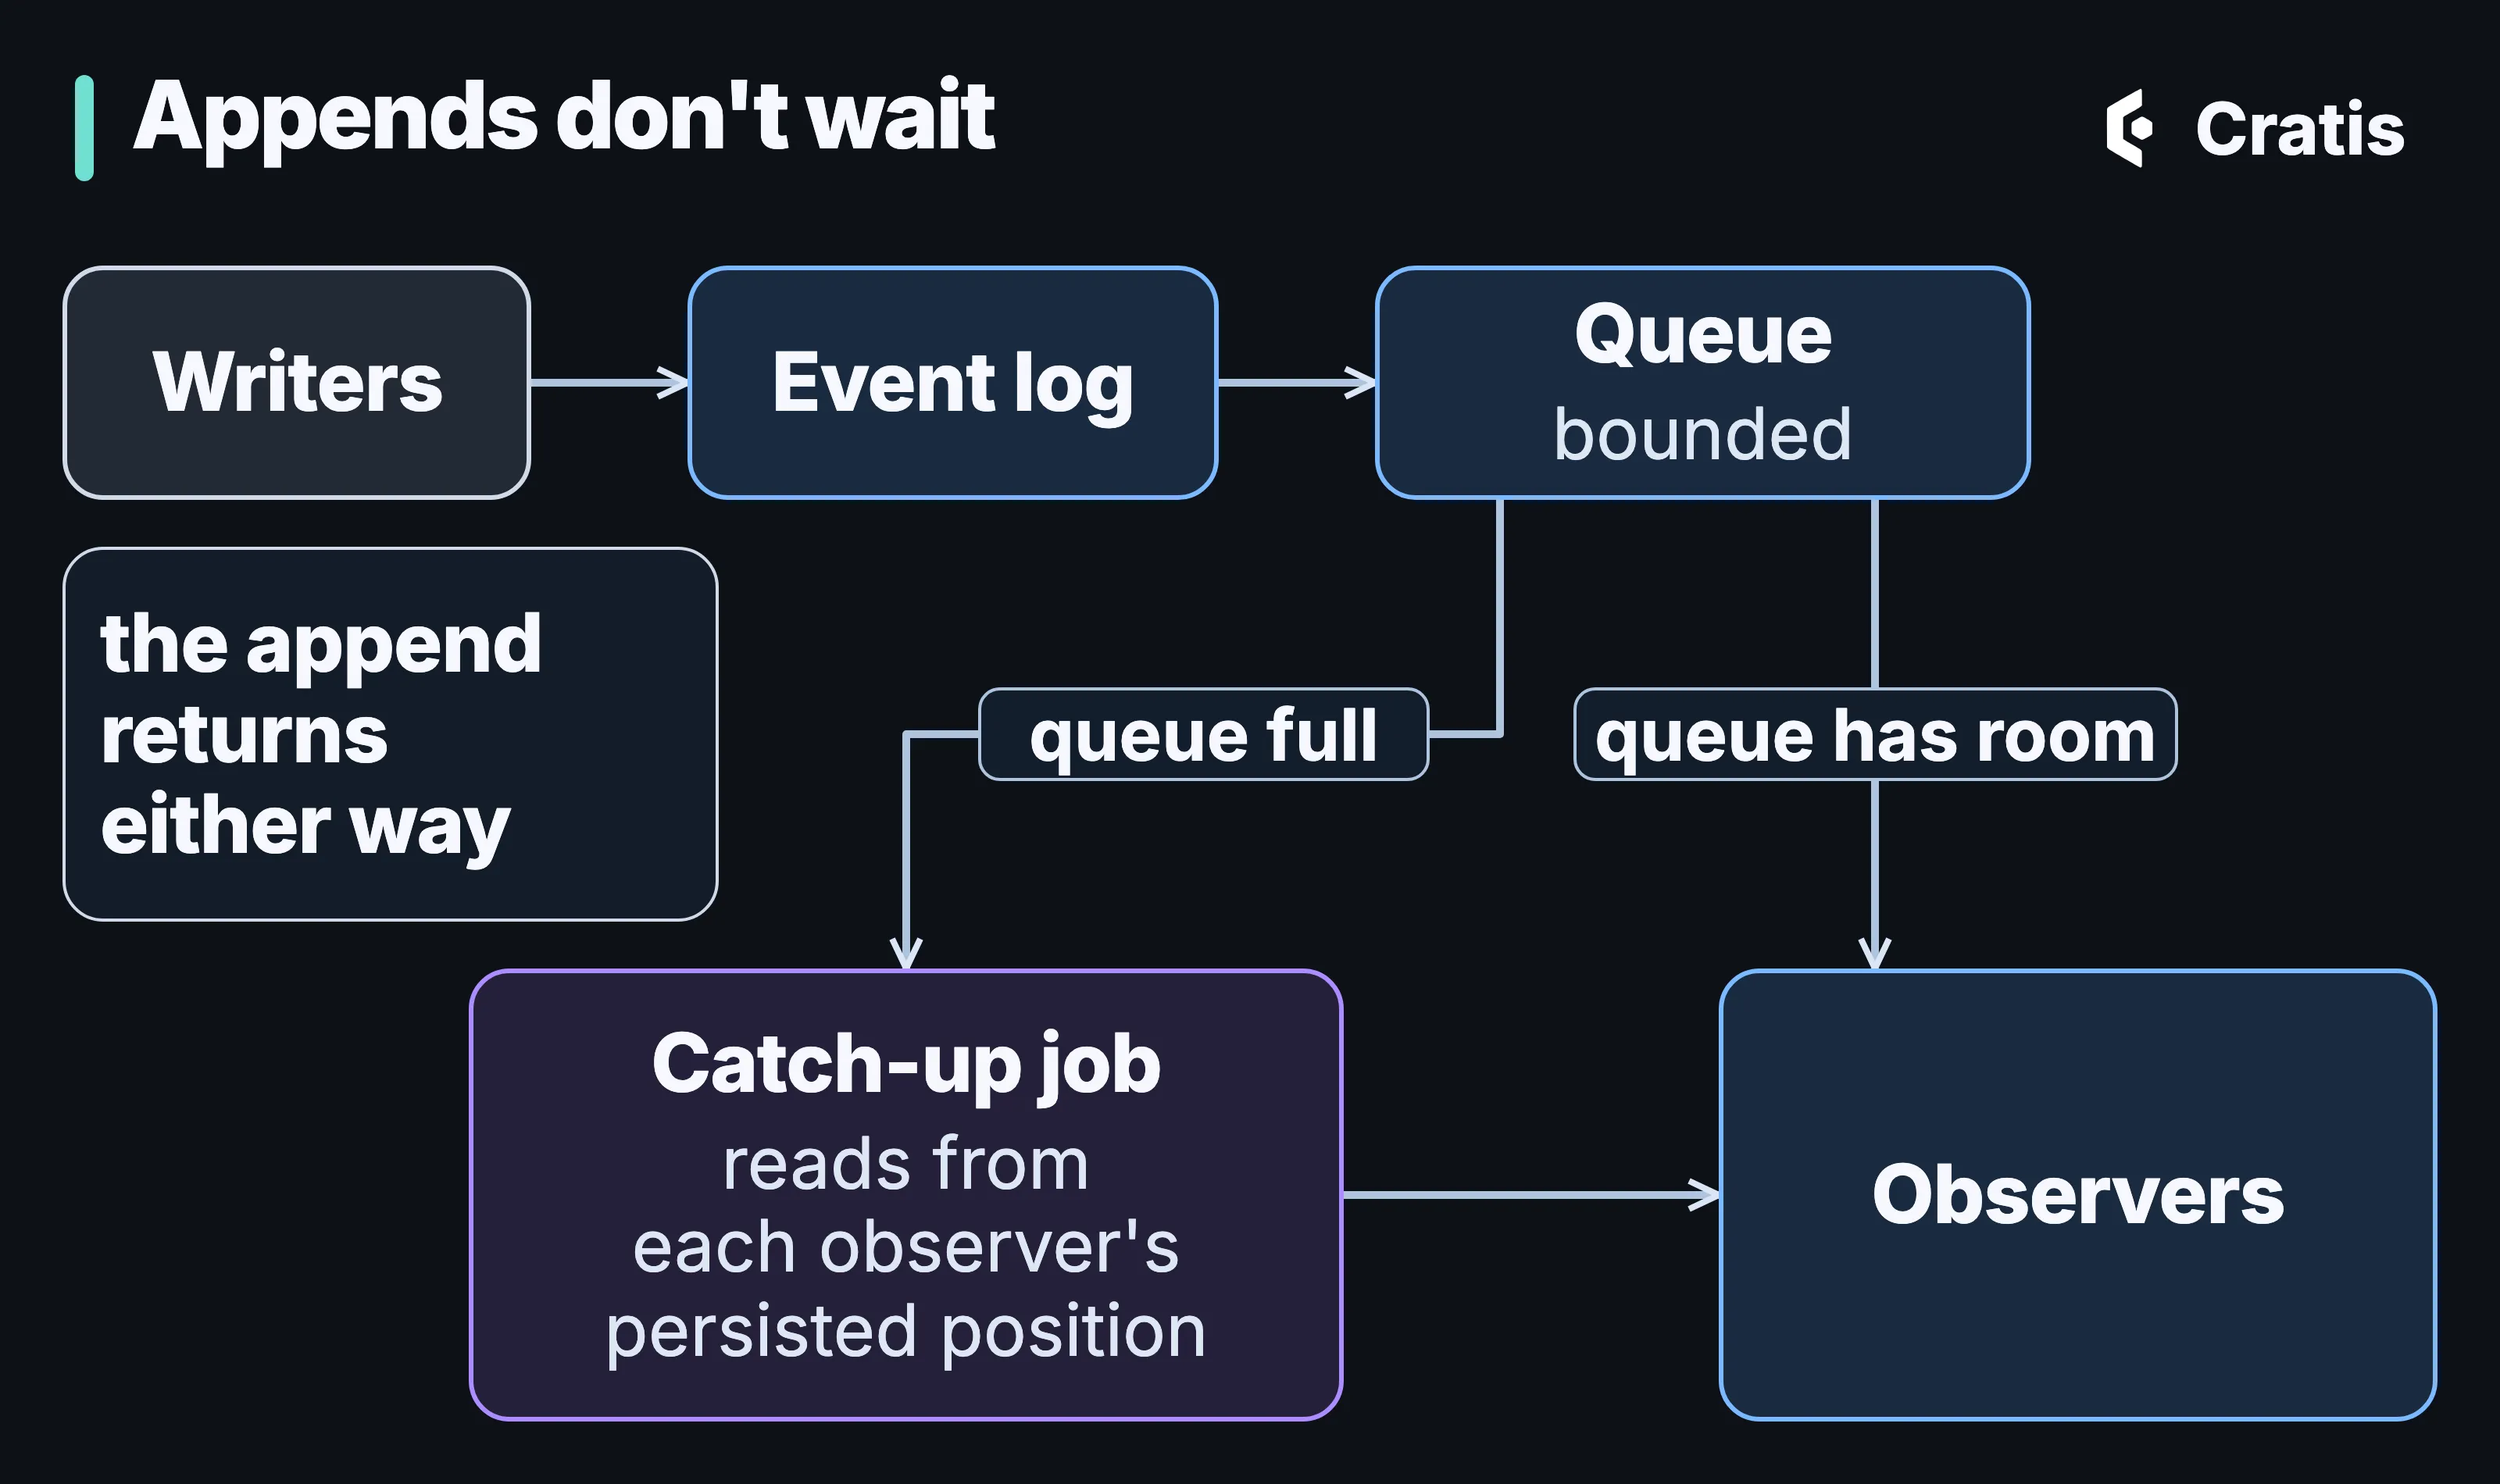
A full queue sends observers to catch up from the log; the append doesn’t block.
The append path does one related piece of housekeeping. The kernel looks for changed constraint definitions at most once a second per sequence, because checking on every append would tie append throughput to how fast one cluster-wide grain can take its turns.
On the observer side, order is per event source. Live delivery hands events over in sequence order, one partition’s batch at a time, to every observer that wants it at once. Partitions run side by side only inside jobs, where a reducer’s or reactor’s replay or catch-up is one step per event source under the step cap. A failed partition stops alone and retries with backoff while the rest continue. Across partitions there’s no order. An event can reach an observer more than once, and projections always run asynchronously, which is Chronicle’s eventual consistency model.
When several instances of one application connect, the observer fans delivery out across them. The default, round-robin, assigns each partition to one instance by its key, so a partition stays with the same instance and keeps its order. random picks an instance per delivery. When an instance disconnects, it’s dropped at once and its partitions go to the others.
subscriberTimeout, 30 seconds by default, bounds how long an observer waits for a subscriber to answer a batch. Giving up abandons the wait, and the subscriber may still be working on the batch when it’s delivered again on retry. A partition whose last attempt was a Timeout doesn’t count toward the quarantine thresholds, because a timeout says the system was congested, and congestion clears.
Read cost
Section titled “Read cost”A read model is materialized by default. The projection writes it as events arrive, a read is a lookup, and the read is eventually consistent. A passive read model computes its state from the log on every read instead, so it’s always current, and its cost grows with the history of the key being read. For the Author list, materialized is the obvious fit. A passive read suits something read rarely, over a short history, where being current matters more than the cost.
Running more than one node
Section titled “Running more than one node”Inside Chronicle covers the kernel architecture and why two servers on default clustering don’t form one cluster. That architecture makes no scale or throughput guarantee.
The server logs a warning when it sees localhost clustering against storage that isn’t local, and it starts anyway. Every node in a multi-node deployment has to set the clustering type to MongoDB, with the same cluster ID and service ID:
Cratis__Chronicle__Clustering__Type=MongoDBCratis__Chronicle__Clustering__ClusterId=chronicleCratis__Chronicle__Clustering__ServiceId=chronicleThere are only two clustering types, Localhost and MongoDB, and the second keeps cluster membership in the configured MongoDB storage. MongoDB has to run as a replica set, because appends use transactions. The nodes share the same encryption certificate and storage, the Orleans ports, 11111 and 30000 by default, are open between them, and port 35000 sits behind a load balancer. Nodes on one host need different silo and gateway ports and an explicitly set advertised address. The production guide has a two-node Compose example. In-memory storage doesn’t share state across a cluster.
Nodes can take roles. roles.eventSequences and roles.observers, both on by default, let you separate the nodes that take appends from the nodes that run observers. Role placement is best-effort today. A node only sees its own role settings, so a grain can still land on another node whose role is switched off. Treat the roles as a scheduling hint, and run every node with every role when every node must accept every grain.
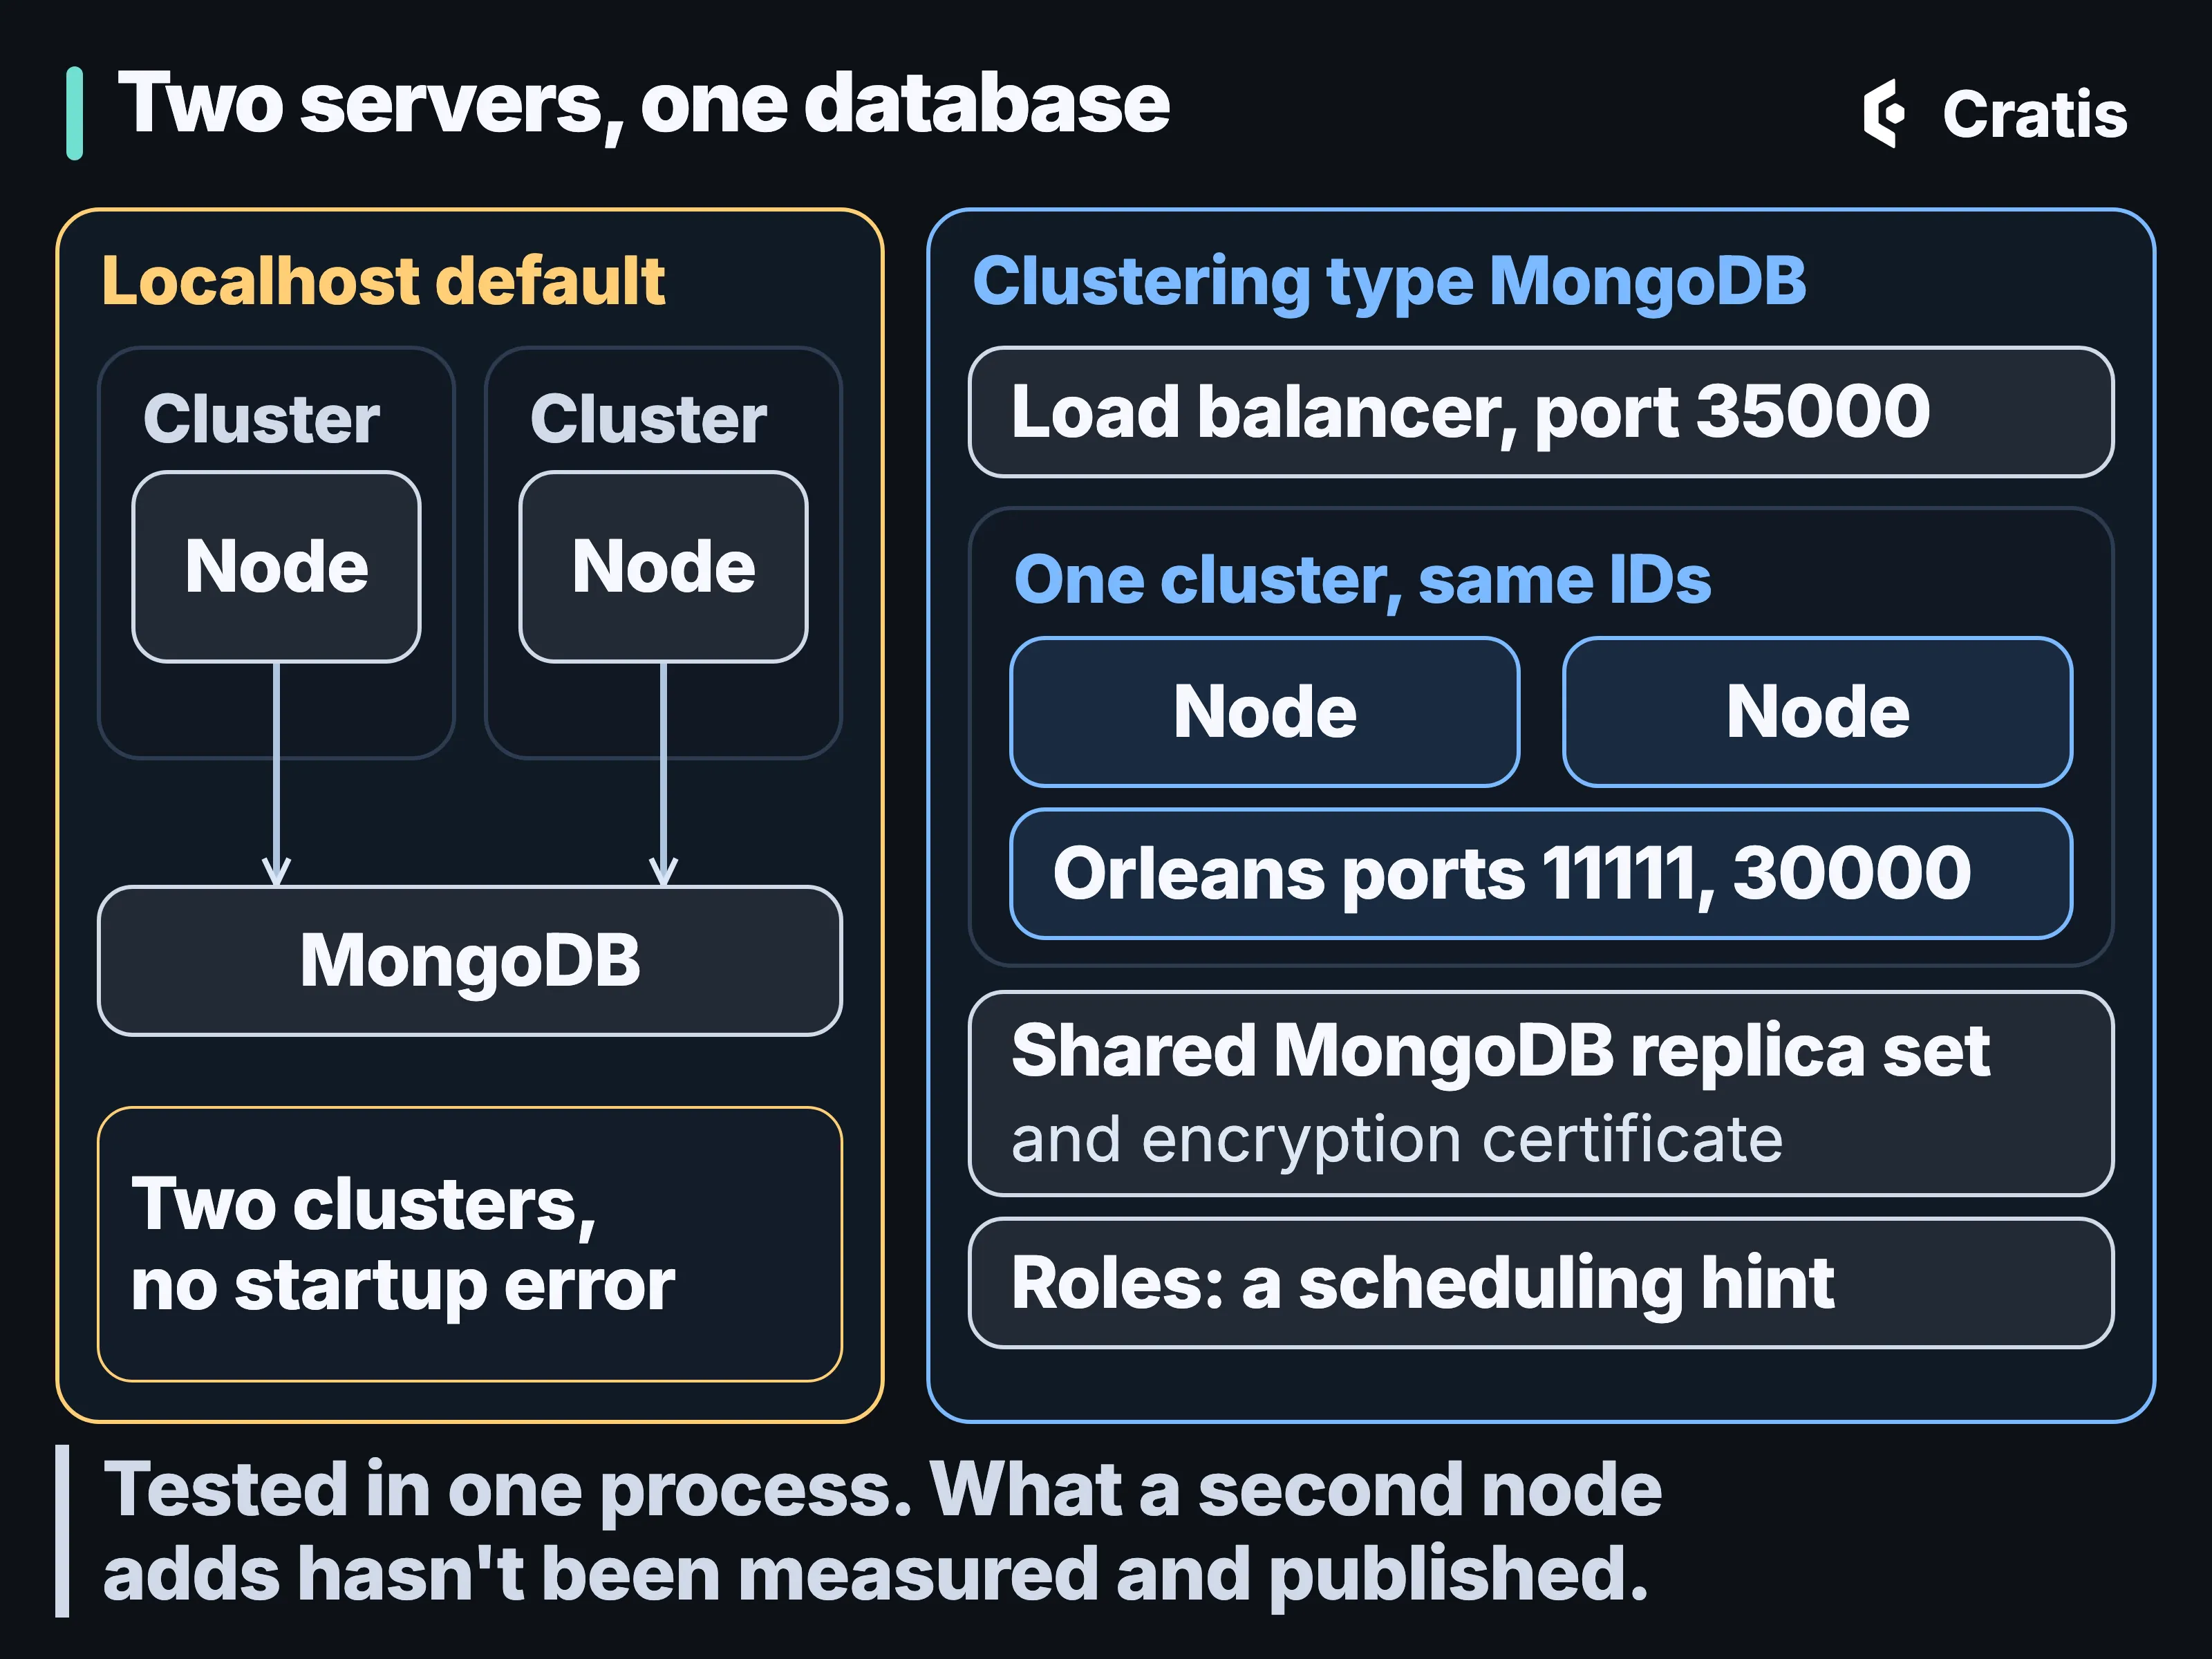
The default gives two servers two clusters; a shared cluster needs the MongoDB type on every node.
What’s been shown about a cluster is limited. Chronicle’s integration tests run an Orleans cluster of two silos in one process, with event sequences on one and observers on the other, and check that a reactor, a reducer and a projection work across it. A clustering benchmark suite compares one silo, two silos and two silos with split roles, and it runs on demand with no published results. Its silos share one machine, so it wouldn’t show ideal scaling even when it runs. Chronicle can run as a multi-node Orleans cluster, and what a second node adds in throughput hasn’t been measured and published.
What the benchmarks measure
Section titled “What the benchmarks measure”A single-node benchmark suite runs every night on a GitHub-hosted Ubuntu runner, against the development container with MongoDB inside it. The series on the benchmarks page ends at a run from August 2026, and the nightly runs since then haven’t been added to it. Each benchmark runs one to three warmups and five or ten measured iterations. The last entry in that series gives these mean times:
| Benchmark | Mean |
|---|---|
| Append one event | 8.98 ms |
Append 10 / 100 / 1,000 events in one AppendMany |
12.9 / 34.1 / 239.9 ms |
| Read a materialized instance, 10 / 100 events of history | 4.30 / 3.49 ms |
| Read a passive instance, 10 / 100 events of history | 7.77 / 11.67 ms |
| Replay a projection over 1,000 / 10,000 events | 328.9 / 1,508.0 ms |
One AppendMany of ten events takes 12.9 ms, against 8.98 ms for a single append. In these runs a materialized read didn’t grow with the history, and a passive read did.
The limits are as specific as the numbers. It’s one runner type on shared hosted hardware, and per-commit numbers from hosted runners are noisy. The observer benchmarks, projecting, reducing and reacting to events, append everything to one event source, so they never exercise partitions running in parallel, and their window includes the append and a completion poll that puts a floor of roughly 60 to 70 ms under every result. None of it is an events-per-second figure, and there are no benchmarks for comparing storage providers, for job step parallelism, or for what happens when a queue fills up.
Tuning a production deployment
Section titled “Tuning a production deployment”Start with the deployment and restore requirements in Running Chronicle and a Cratis application in production, and make every observer idempotent before tuning delivery.
The tuning knobs are observers.subscriberTimeout, observers.maxRetryAttempts, events.queues and jobs.maxParallelSteps. None of them comes with a sizing rule. Chronicle’s configuration examples show 8 queues and a 5-second subscriber timeout as illustrations, and the right values for a given system come from measuring that system.
Watch the Author replay as a job, allow for the batches a crash can repeat, and measure what a second server adds before relying on it.